CAC Payback Period and Why Investors Watch It Closely
Investors use it to determine whether your growth machine needs outside capital to keep running.
CAC payback period tells you how many months it takes to earn back what you spent to land a customer, using the gross profit that customer generates. Some people call it "Months to Recover CAC," which is clunkier but a lot more honest about what it's actually measuring. Investors watch this number closely because it answers a question CAC alone can't touch: is the growth machine self-funding, or does it run on someone else's checkbook?
CAC by itself is a number without context. It tells you what got spent, not whether the customer stuck around, expanded their spend, or churned out after two months. Payback period folds revenue, margin, and time into one figure, and that's exactly why it beats CAC as a standalone metric, and beats LTV:CAC as a north star too. LTV is a projection that can stretch out indefinitely in a high-retention SaaS model, and projections are where founders go to tell themselves comforting stories. Payback forces an actual, time-bound answer: not "eventually," but "month 14."
The formula fits on a napkin: CAC divided by (ARPA times gross margin percentage) equals payback in months. The trouble is that almost nobody runs that formula the same way twice, and that inconsistency is the whole scandal hiding inside this metric.
Why nearly 70% of SaaS companies get this number wrong
Close to 70% of SaaS companies miscalculate this. Rarely is it a math error. It's an inputs problem, and the most common mistake is dropping real costs out of the numerator, or worse, using raw ARPU in the denominator instead of margin-adjusted ARPU. That second one sounds like a rounding issue until the numbers actually run.
Take a company that reports 80% gross margins but really runs at 60%. The true payback period, the one built on cash actually recovered, comes out 33% longer than whatever number is sitting in the board deck. Telling investors the customer pays back in 12 months when reality says 16 affects whether the company's cash position matches its reported figures, and that gap gets found out eventually.
The exact same underlying data can produce a reported payback anywhere from 12.5 months to 25 months, depending on which of four common methods gets used. Standard payback, Bessemer's S&M-based version, cohort-based payback, and net-new-ARR payback all answer slightly different questions, and none of them are interchangeable. A company can pick the flattering method without disclosing it, and technically nobody lied. But the story told was a very selective cut of the truth. Investors who've sat through enough decks know to ask which formula produced the number before believing a word of it, and that question alone ends most of the confusion in about ten seconds.
Where the median sits in the 2025-2026 benchmark data
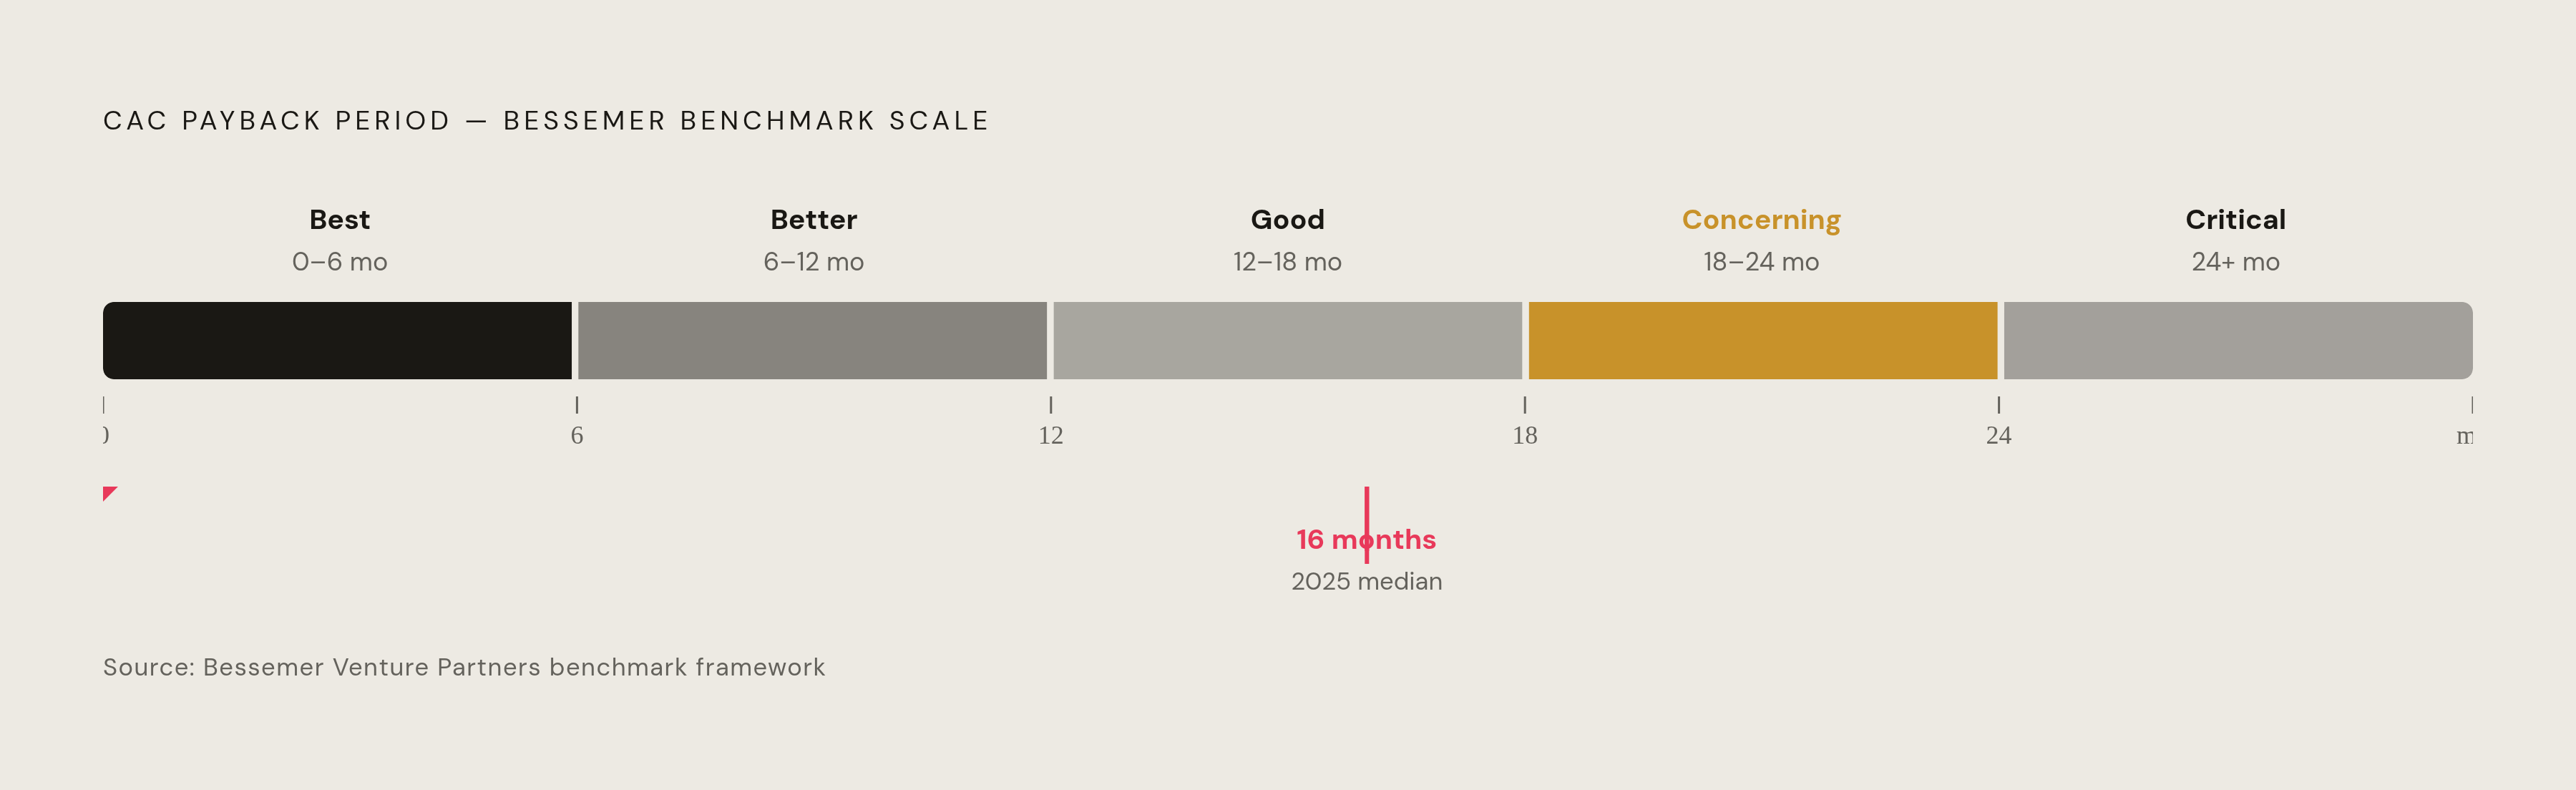
The 2026 Aleph x Benchmarkit SaaS & AI Performance Benchmarks report, built on full-year 2025 actuals across 342 SaaS and AI-native software companies, puts the median B2B SaaS CAC payback period at 16 months. Top-quartile companies recover CAC in 6 months or less. Bottom-quartile companies take 24 months or more, and the single worst performer in the sample sat at 48 months. Four years to break even on one customer is a hobby with invoices. It's a hobby with invoices.
Median payback improved from 18 months in 2024 to 16 months in 2025, an 11% gain and one of the largest single-year jumps in four years of benchmark data, and the direction of that change signals more about the business than any single month's number does. Median payback improved from 18 months in 2024 to 16 months in 2025, an 11% gain and one of the largest single-year jumps in four years of benchmark data. That improvement reflects a meaningful shift in how the benchmark cohort approached acquisition, with companies getting more disciplined about who they sold to instead of getting louder about selling to everyone.
Whether that discipline survives 2026 is the real question here. Efficiency gained through belt-tightening has a habit of vanishing the second growth pressure returns and budgets loosen back up. History says watch this number the moment revenue targets get aggressive again.
How ACV, sales motion, and growth rate change the benchmark that applies to you
A 16-month median is close to useless without knowing where a company actually sits inside it. Deal size changes the picture completely; founders end up panicking over numbers that were never comparable to begin with.
Sub-$5K ACV companies post a 9-month median, since high-volume, low-touch digital motions recover cash fast. At $10K to $25K ACV, the median rises to 12 months. Climb to $25K to $50K and it's 14 months. At the enterprise tier, payback lengthens considerably, driven by longer sales cycles and the overhead of field sales teams, though efficient acquisition remains possible even at larger deal sizes. It's just a lot harder to pull off at the top end.
Benchmark an enterprise-motion company against the flat 16-month median and it looks like it's underperforming when it isn't. Comparisons only mean something within the same ACV band, full stop. Segment data backs this up: SMB companies (under $15K ACV) run 8 to 12 months, mid-market ($15K to $100K ACV) runs 14 to 18 months, and enterprise (above $100K ACV) runs 18 to 24 months.
Growth rate adds a wrinkle that trips up a lot of intuition. Companies growing faster than 50% post a 10-month median payback, so fast growth and efficient acquisition clearly aren't opposites the way people assume. The relationship between growth rate and payback isn't always linear, and mid-range growers can face elevated CAC while searching for their next growth lever, a tax on the search that doesn't get refunded until the company finds what it's looking for.
Sales motion and market focus shape payback meaningfully, and the benchmark that applies depends on which motion a company actually runs. Vertical SaaS often trades a longer payback up front for stronger retention within its specialized market, so no one should judge a vertical SaaS company by a broad-market yardstick.
How investors use CAC payback as a capital efficiency signal
When an investor asks about CAC payback, the real question is how much outside capital the growth actually requires to keep running, and that determination comes directly from the payback figure itself. Payback period is the cleanest available answer to that question. It comes up in nearly every diligence call, and founders often don't see it coming.
The mechanics come down to working capital. Every dollar spent on acquisition sits locked up until that customer's gross profit pays it back. The longer the payback window, the longer that cash stays out of reach, and the more capital a company needs on hand just to keep growing at the same clip. High growth on top of a long payback period doesn't scale the capital requirement in a straight line. It compounds.
That compounding carries a dollar cost, not just a strategic headache. At Series A, the implied cost of equity typically runs 35% to 50% annually, and each additional month of payback beyond the acceptable threshold erodes equity value through dilution math. Strip away the spreadsheet language and payback period is a dilution calculator dressed up as a growth metric.
Bessemer's rating scale, widely used across the venture world, sorts payback into five bands: 0 to 6 months is best, 6 to 12 is better, 12 to 18 is good, 18 to 24 is concerning, and anything past 24 months is critical. Know which band a company is in before an investor brings it up in the room, because they will, and "let me get back to you on that" is not an answer that survives a term sheet negotiation.
Where seed-stage founders land on this metric, and what the fundraising timeline implies
Seed-stage fundraising in 2026 looks a lot like Series A fundraising did just a few years back: more selective, more competitive, and a much higher bar for proof before anyone writes a check. A much smaller share of seed-stage companies go on to raise a Series A today than during the boom years of 2021.
The clock has stretched too. Average time between seed and Series A now runs 616 days in 2026, a stretch that reflects investors penalizing founders who raised too early on thin metrics. Investors are penalizing the founders who raised too early on thin, unconvincing metrics and had nothing left to show eighteen months later. It's investors penalizing the founders who raised too early on thin, unconvincing metrics and had nothing left to show eighteen months later.
That's why seed-stage diligence now digs into CAC, LTV, burn rate, and CAC payback period, sometimes as early as the first meeting. Nobody expects a seed-stage company to have product-market fit nailed down yet. What investors want is a believable path toward it, with numbers that hold up under a second look, not just a first glance.
By the time Series A conversations start, expectations sharpen considerably. In 2026, investors generally want to see CAC payback under 18 months, alongside $1M to $3M in ARR, year-over-year growth in the 2x to 3x range, gross margins at 60% or higher, and net revenue retention above 110%. Missing payback badly enough means the other four numbers won't save the round. It's the lever that carries the most weight, and founders who treat it as one metric among five are misreading the room.
Four operational levers that shorten CAC payback at the seed stage
Payback period isn't fixed. It moves, and it moves fastest at the seed stage, before spending habits calcify into permanent infrastructure that's expensive to tear out later.
Tightening the ideal customer profile before spending more on acquisition is the highest-leverage move available, and it's usually the first thing companies skip when growth pressure kicks in. Leads that match the ICP cost less to close, full stop. For true ICP customers, the LTV:CAC ratio should be 3:1 or better; stray outside that profile and the ratio can flatten to break-even or worse. Playvox is a documented case of what real tightening looks like: the company achieved a 10x decrease in acquisition cost by narrowing in on better-fit accounts instead of casting a wider net. Real ICP work means pulling the best customers by lifetime value, finding the three or four traits (firmographic and behavioral) they actually share, and cutting everyone who doesn't fit that shape. "VP of Sales at a mid-market SaaS company" is a job title with a company size stapled to it, and that specificity is the whole point.
Shifting channel mix toward organic before scaling paid spend is the second lever, and it's the one most founders get backwards under pressure to show growth fast. Organic channels carry structurally lower CAC than paid ones, and referrals sit at the top of the list as the most cost-efficient acquisition channel available to anyone. The sequencing matters specifically at seed stage: build the organic foundation first, then layer paid spend on top of it. Reaching for paid acquisition first just because it's faster to switch on is how companies end up explaining a 25-month payback period to an investor who's already seen the 16-month median staring back at them from the same deck.
Sources
- CAC payback period benchmarks for SaaS (2026)
- What is CAC Payback? Formula, Benchmarks & How to Reduce it
- Your guide to CAC payback period
- How I Calculate the CAC Payback Period - The SaaS CFO
- CAC payback period guide and formula
- CAC Payback Period, Your Formula to Longterm SaaS Profitability - Custify Blog
- CAC Payback Period Explained: Formula + Strategies to Reduce It | Saras Analytics
- CAC Payback Period: 8-24 Months by Segment (939 Companies)