Net Revenue Retention as a Marketing Signal for Investors
Investors now prioritize NRR because it reveals whether customers fund future growth.

Net revenue retention used to be a footnote in the finance deck. Now it's the first slide investors flip to, because it answers a question growth metrics can't: did the business actually earn the customers it already has, or did it just rent them for a quarter? That distinction decides valuations, and increasingly, it decides who closes a Series A and who spends another 20 months bootstrapping on fumes.
The old playbook, the one that said burn cash, fill the funnel, worry about retention whenever there's time, worked fine when capital was basically free and public markets rewarded top-line growth no matter how leaky the bucket was underneath. That era is over. Customer acquisition costs climbed, SaaS markets matured, and investors stopped asking "how fast is new revenue coming in" and started asking "how well does the existing customer base fund what comes next." Capital efficiency is the new house rule. NRR is the metric that captures it, because it rolls up churn, contraction, expansion, upsell, cross-sell, and price increases into a single number that either goes up or doesn't.
What NRR measures and how to calculate it cleanly
The formula isn't complicated: NRR equals starting ARR, plus expansion ARR, minus contraction ARR, minus churned ARR, all divided by starting ARR. Run that math over a fixed cohort of existing customers, typically across 12 months, and exclude every new logo signed during that window. New customers don't belong in this number. Ever.
That exclusion is where most people mess up the calculation, and it's not always an accident. The most common error is letting new-logo revenue quietly leak into the expansion term, which inflates NRR and papers over a churn problem that's very much still there. Usage-based pricing models make this worse, because the line between "new ARR" and "expansion ARR" gets blurry fast. Someone signs a new usage-based contract in month two, ramps their usage in month four, and suddenly that ramp gets counted as expansion on a customer who wasn't even in the starting cohort. Sloppy accounting, real consequences.
NRR also has a quieter sibling: gross revenue retention, or GRR. GRR strips out expansion entirely and measures pure survival, how much revenue would remain if nobody ever grew their spend. It's capped at 100%, which makes it the clearest read on whether the bucket leaks in the first place. NRR, by contrast, is uncapped. A company can hit 110% NRR while still losing customers, as long as the ones who stick around spend enough to cover the gap.
The distance between NRR and GRR equals expansion ARR divided by beginning ARR, and reading the two together answers two separate questions. Are customers leaving? And are the ones who stay actually growing? In 2025, the median NRR sat at 102% while median GRR sat at 84%. Do the subtraction and you get an 11-point gap: expansion is doing an enormous amount of heavy lifting to cover real, measurable churn that the GRR figure reveals. An NRR of 102% looks healthy in isolation. Paired with an 84% GRR, it looks like a handful of expanding accounts propping up a business that's bleeding customers everywhere else, and that kind of NRR is fragile. Lose one big expanding account and the whole number collapses.
The benchmark landscape in 2026 misleads as a single number
Start with the headline figure, because it deserves some skepticism before anyone treats it as gospel. The 2026 Aleph x Benchmarkit SaaS & AI Performance Benchmarks, drawn from 342 SaaS and AI-native companies, puts median B2B SaaS NRR at 102% for 2025, with top-quartile companies reaching 110%. Fine numbers. Nearly useless without segment context.
Break it down by contract size and the picture changes fast. Enterprise SaaS, meaning average contract values above $100K, posts a median NRR of 118%. Mid-market, in the $25K to $100K ACV range, is 108%. SMB, under $25K ACV, is 97%. That last number looks like a red flag to anyone comparing it against the 102% headline figure, but it is exactly median performance for that segment. It's exactly median performance for that segment. The same 97% NRR at an enterprise-focused company would be a genuine problem, maybe even a dealbreaker in diligence. Context is essential here. It's the whole ballgame.
Stage matters just as much as segment. Companies below $5M ARR post a median NRR of 94%, mostly because there isn't enough installed base yet, or enough customer success capacity, to drive systematic expansion. Companies above $100M ARR are at 103% median, with the 75th percentile hitting 115%. SaaS Capital's survey of more than 1,000 private B2B SaaS companies found a median NRR of 103% and median GRR of 91% in companies ranging from a few million up to a much larger ARR threshold, with the 90th percentile reaching 117.9%. So the goalposts move depending on where a company sits on the growth curve, and any founder benchmarking against a single blended average is comparing apples to a fruit basket.
Pricing model turns out to be the single biggest structural lever here, bigger than most founders realize. Usage-based companies post a median NRR of 108% against 98% for seat-based pricing, a 10-point gap that has nothing to do with sales execution and everything to do with mechanics. m3ter's analysis found usage-based SaaS routinely hits 115% to 130% NRR, compared to 95% to 105% for flat-rate models. The logic is almost embarrassingly simple: revenue scales automatically as customers realize more value, without anyone picking up the phone to renegotiate a contract. Usage-based pricing now shows up in roughly half of public SaaS companies, up from 27% in 2018, and seat-based pricing is running into a structural headwind of its own. AI-driven headcount efficiency means customers are consolidating roles and shrinking seat counts, which quietly erodes seat-based NRR even when the underlying relationship is healthy.
How NRR maps to valuation multiples in dollar terms
Picture two companies, both at $8M ARR, growing at the same rate, with matching gross margins. One sells for $36M. The other sells for $60M. The only meaningful difference between them is NRR, and that gap is not a rounding error. It's the entire premium buyers are willing to pay for a customer base that grows itself.
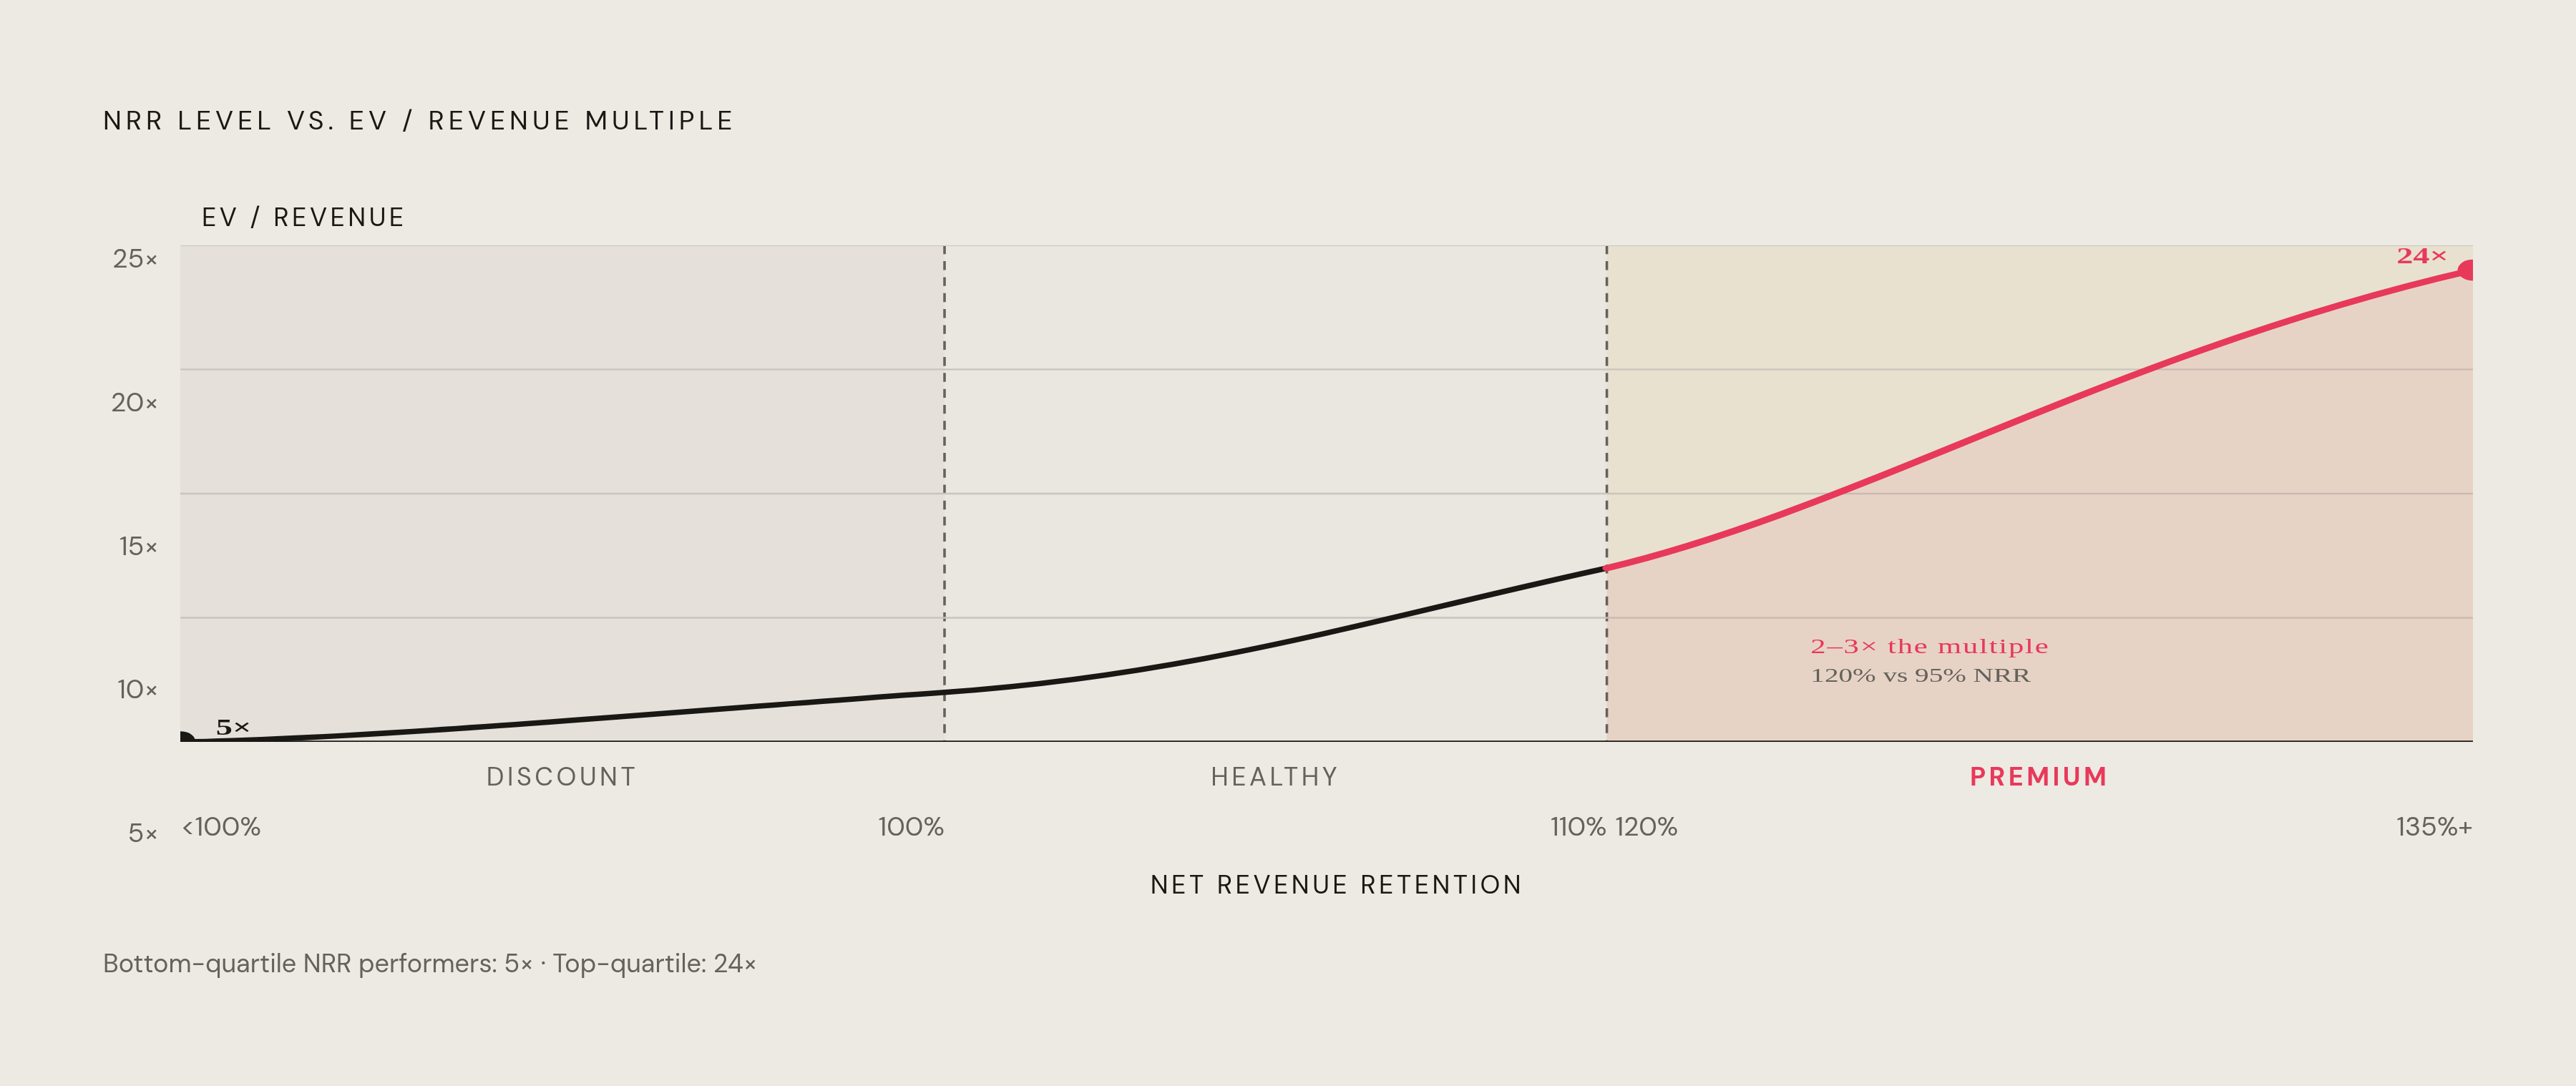
The relationship between NRR and valuation multiple isn't a straight line either. It bends upward, hard, once NRR clears 110%. Top-quartile NRR performers trade at a median 24x EV/Revenue. Bottom-quartile peers are at 5x. A company running 120% NRR can command two to three times the valuation multiple of one at 95% NRR, even at similar growth rates. FE International's private market shorthand: below 100% NRR, buyers apply a discount. Above 110%, that's healthy territory. Above 120%, that's premium multiple territory, the zone where buyers start competing for the deal instead of negotiating it down.
The nonlinearity makes sense once framed as a compounding problem rather than a snapshot. Investors aren't pricing today's revenue line, they're pricing the trajectory baked into the existing customer base. A company sitting on $10M ARR with 120% NRR grows that base into a substantially larger figure five years out with zero new customers acquired, arithmetic on autopilot rather than a projection. That's not a projection, it's arithmetic on autopilot. SaaS Capital's research backs this up from the growth side too: moving NRR from the 90 to 100% band into the 100 to 110% band improves overall growth rate by roughly 5 percentage points, and companies at the highest NRR tiers grow about 83% faster than the population median. NRR doesn't just describe a healthy business. It predicts one.
The stage-specific NRR thresholds Series A investors apply
At seed, the bar sits lower than most founders assume, and that's by design, not generosity. Top-quartile NRR for seed-stage companies (roughly $1M to $3M ARR) is around 94%, according to ChartMogul benchmarking data. Anything near that range, moving in the right direction, is a reasonable place to be sitting when the seed round closes.
What investors actually read at this stage is the trend line underneath the absolute number. What investors actually read at this stage is the trend line. Are customers finding more value over time, or less? Because seed-stage NRR functions primarily as a product-market fit validator, direction of travel here affects the picture more than the destination does. A cohort that expands its usage and spend month over month is telling investors something new-logo growth alone can't: that the product solves a problem customers care enough about to pay more for.
Series A sharpens all of this considerably. The 2026 benchmark from Averi.ai puts Series A NRR expectations at 110 to 120%-plus, a meaningfully higher bar than seed. Falling below 100% at this stage is a serious flag, because it signals the business structurally depends on new-logo acquisition just to hold revenue flat, an unfavorable compounding dynamic that investors price in immediately and rarely negotiate around. Clear 120%, and the company stands out in a competitive process, because it demonstrates a natural expansion engine that compounds without constant new-customer feeding. The logic is consistent across investors: NRR trends showing existing customers finding increasing value over time signal that growth can hold up once the company scales past its earliest customers.
Timeline pressure compounds all of this in a way founders tend to underestimate. The gap between seed close and Series A close routinely stretches well beyond a year, often more than 20 months. NRR improvement doesn't happen in a sprint at the end of that runway. It has to get built into the marketing and customer success engine from day one, because a metric that measures a full year of cohort behavior can't be manufactured in the final quarter before a raise.
ARR still anchors the Series A conversation, but it's stopped being sufficient on its own. The practical revenue bar for a Series A has risen meaningfully in recent years, and the threshold now often sits at $5M ARR or more before a term sheet appears. Strong headline revenue without strong retention economics behind it won't close a round anymore. Investors have seen that movie, and they know how it ends.
Why NRR is a marketing output, not just a finance metric
Most founders file NRR under finance, something customer success owns and the CFO reports on. Most founders file NRR under finance, something customer success owns and the CFO reports on, but that's backwards. The inputs that determine NRR get set months before a contract is even signed, which makes NRR, at its core, a marketing output wearing a finance costume.
Trace the causal chain and it starts with ICP precision. Marketing that reaches the right customers, the ones whose actual problems the product solves, produces an installed base that sticks around, expands, and drives NRR upward over time. Message accuracy matters just as much: customers who buy based on an honest picture of what the product does get the outcome they were promised, which cuts down on one of the most common and least discussed sources of revenue contraction, expectation mismatch. Nobody churns because the product failed. They churn because the product didn't do the thing the sales deck implied it would.
NRR, viewed this way, is really just an aggregate of thousands of individual purchase decisions revealing whether the product is solving an increasingly important problem for each customer. Marketing found the right audience and told them the right story, or it didn't, and that verdict appears in NRR months later.
There's a cost to getting this wrong that never appears on a dashboard until it's too late. A startup that widens its ICP to juice top-of-funnel volume acquires customers who churn faster, expand less, and drag NRR below 100%. That cost is invisible in every acquisition metric marketing typically reports on, a customer acquisition cost figure, conversion rate, pipeline velocity, and it instead appears in retention economics a year later, fully formed and hard to reverse. Positioning plays a role here too. A company that wins on a clearly differentiated position, rather than competing on feature parity or price, attracts customers who switch less and expand more, and that effect appears in GRR before it appears in NRR. Positioning is the seawall. NRR is just the tide gauge that eventually tells you whether it held.
The marketing decisions that move NRR in the 12-18 months before a Series A
None of this happens on the finance team's timeline, and that's the real headache for founders staring down a Series A 18 months out. NRR is a lagging indicator built on marketing decisions made well before the metric ever moves, so the window to fix it isn't the quarter before the raise, but the year and a half before it.
ICP tightening has to happen early, because every customer signed under a loose or overly broad ICP appears in the retention cohort a year later, dragging the number down regardless of how good the product gets in the meantime. Positioning work matters on the same timeline: a company that sharpens its differentiated story attracts buyers who chose the product for what it actually does, not because it happened to be cheaper or more familiar that quarter, and those buyers are the ones who stick around and expand.
Pricing architecture is the lever with the most leverage, literally. Shifting toward usage-based or value-based pricing, where the structural data shows a 10-plus point NRR advantage over flat seat-based models, changes the ceiling on what NRR can even reach, independent of how well customer success executes. And onboarding and activation messaging, the stuff marketing hands off to product and customer success, sets the early trajectory for whether a customer's usage climbs or flatlines in month one, which is often the strongest predictor of where that account sits on the expansion-versus-contraction spectrum twelve months out.
None of these are finance decisions. They're marketing decisions, made early, that finance simply gets to report on later. Founders who understand that sequencing walk into Series A conversations with a number that isn't a surprise. Founders who don't spend the diligence process explaining, awkwardly, why the number showed up the way it did.
Sources
- Net revenue retention (NRR) benchmarks (2026)
- Net Revenue Retention (NRR) Explained | SaaS Valuation Guide 2026 | FE International
- Net Revenue Retention Benchmarks 2026: SaaS NRR Data
- Net revenue retention benchmark SaaS: what the numbers actually mean for your stage
- B2B Customer Retention Statistics for 2026 (New Data) 📊
- saasmag.com
- crv.com