How to Present Marketing Metrics in a Data Room
Structure your marketing case to show investors compounding growth, not just data compliance.

Presenting marketing metrics in a data room is an act of argument. The right evidence, in the right order, shows investors that your marketing motion is compounding and ready to scale. A filing cabinet holds documents. A closing argument uses those documents to make a case.
Why the data room is a closing argument, not a compliance archive
The partner meeting went well, the investor asked for the data room, and the founder assumed the hard part was over. But the meeting generates conviction. The room must convert that conviction into a wire, without the founder there to explain every chart. At seed, when product and revenue data may be limited, the way you present evidence carries unusual weight. Organization becomes a signal of how you run the company.
Speed matters because enthusiasm has a shelf life. Answering document requests one at a time turns diligence into a queue, while a complete room lets investors examine the business in parallel. Marketing materials matter because they show whether growth comes from a system that works or from work that does not fit together. The room’s job is therefore not merely to answer questions after they arrive. It should remove the need to ask them.
How investors actually read a seed data room — and what they skip
Investors do not read a seed data room like a novel, patiently trusting that the good part starts later. They spend little time on the deck, and attention is unevenly distributed. Traction and financials attract most of it, while legal and team materials receive a fraction. The financial model is usually the next stop after the deck. A long presentation gives the strongest evidence more places to hide.
The deck and metrics dashboard can be available early, with the financial model and customer contracts shared through a separate link after genuine interest. Deeper materials can sit behind a simple NDA, but the deck itself should not. Page-level engagement analytics show which sections investors read and where they stopped, giving follow-up a useful focus. If an investor cannot see the marketing motion working within the first few minutes of opening the room, it effectively does not exist.
The five files a seed data room actually needs — and where marketing lives in each
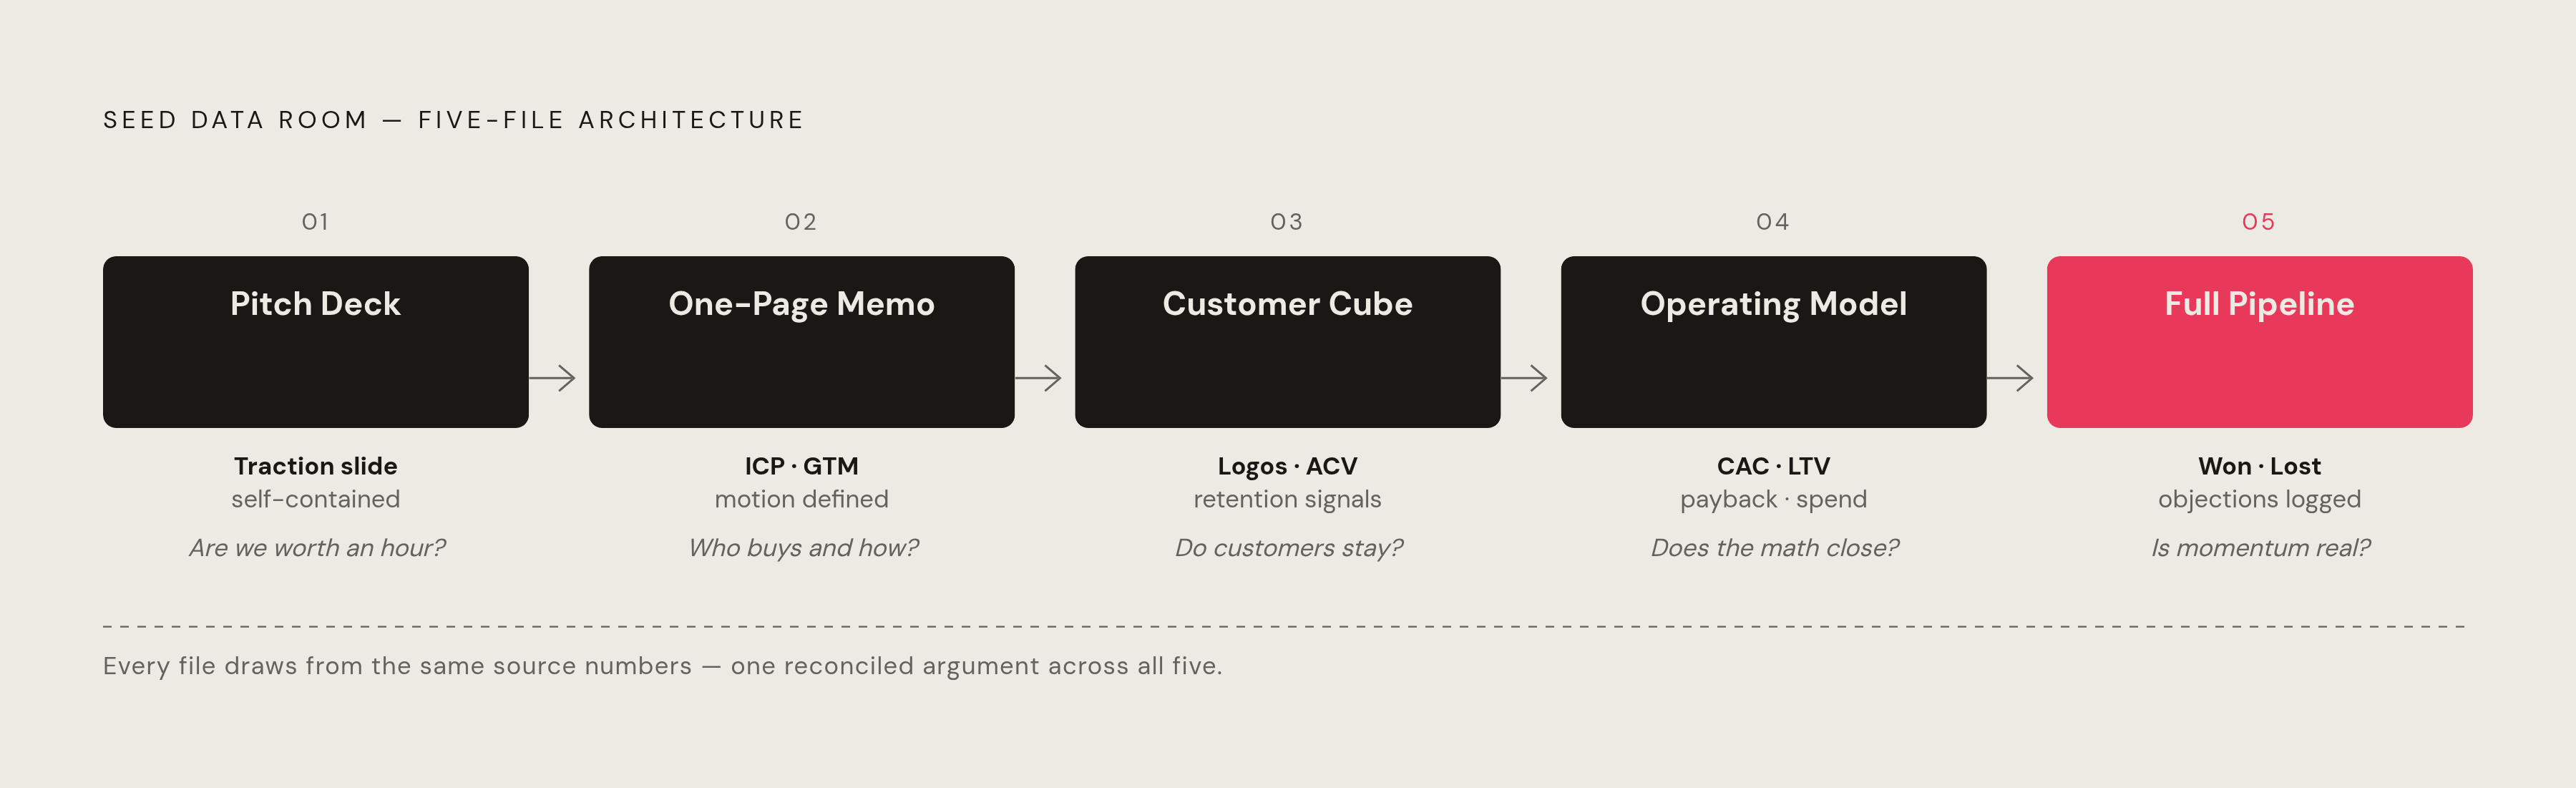
The core architecture consists of five reconciled files, namely the pitch deck, one-page memo, customer cube, operating model, and full pipeline. The deck makes the first case, with a self-contained traction slide that does not depend on live narration. The one-page memo condenses the business story and establishes the ideal customer profile, or ICP, and go-to-market motion. An investor should not have to go on a scavenger hunt through either file.
The customer cube supplies the detail behind that claim, including customer logos, segment, ACV, and retention signals. The operating model connects CAC, LTV, payback period, and channel-level spend to revenue projections. The full pipeline shows deals won, lost, and in progress, so investors can see how marketing shapes each opportunity. Lost deals belong here too, because logged objections show where the team has tested and changed its messaging. These files serve different questions, rather than offering five versions of the same sales pitch.
A thicket of M&A-style diligence folders is not a substitute for this structure. For founders who are talking to several investors, the platform they choose also shapes how much they can see of what each investor reads. Peony offers page-level engagement analytics, which can show whether an investor read the traction slide and stopped. That is useful information for follow-up.
What the traction slide must prove — and in what order
The traction slide needs one primary metric that best demonstrates the growth trajectory, followed by two or three supporting proofs. Depending on the business, that lead signal might be ARR growth rate, active user growth, or LOI volume. At seed, a smaller MRR growing quickly can give investors stronger evidence of traction than a larger MRR barely moving.
Suppose ARR growth leads the slide. Retention then answers whether customers stay, and CAC helps explain whether acquiring more of them is becoming sustainable. Named customer logos or partnership milestones can support the claim that the buyer is real and repeatable. Positive numbers with no link to each other leave the investor to work out how they fit. Strong growth with no proof of retention all but sends churn a calendar invitation.
Pre-revenue companies can make an honest argument using waitlist signups, LOI commitments, pilot results, DAU/MAU engagement, or customer discovery interviews. These signals need to point toward future revenue, even if they look like revenue from a distance. A direct customer quote, attributed to a named role at a named company type, can anchor the numbers in human validation alongside measurable progress.
Which marketing metrics belong in a seed data room — and why each one earns its place
CAC shows what it costs to win a customer, while LTV shows whether that customer brings back enough value to cover the cost. Payback period shows how long it takes to earn back the money spent to win customers. CAC payback under 12 months signals that acquisition leverage is within what runway can support, and these measures need consistent calculations across documents.
Pipeline velocity shows whether new opportunities are moving fast enough to meet the growth plan. ARR records what has already happened, so it cannot carry the forward-looking case alone. MQL-to-SQL conversion shows whether marketing leads become qualified sales opportunities, while MQL-to-customer conversion shows whether they actually close. A growing pile of leads is not the same thing as a growing business. If the conversion rates in the data cannot deliver the revenue the operating model assumes, its forecast has no firm basis.
Retention shows whether customers keep getting value after they buy. Monthly churn below 5% is the benchmark threshold for seed-stage B2B SaaS. Bringing in many customers while churn is high suggests either the wrong ICP or a product that does not do what the marketing promises. Where the product supports expansion, net revenue retention shows whether existing customers contribute to compounding revenue.
Channel-level CAC shows whether the system can win customers without the founder closing every deal. Differences by source, especially when lower-CAC channels are scaling, make the transition beyond founder-led sales visible. Organic traffic trends and content-influenced pipeline support that account by showing that paid acquisition is not the only lever. They belong behind the unit economics. Leave out impressions, follower counts, and email open rates that say nothing about revenue conversion, and give every retained metric a time frame and baseline.
How to present ICP definition and GTM validation as investor-grade evidence
Before investors can judge acquisition performance, they need to know who is being acquired. An ICP that investors can use spells out the company profile, the buyer’s job title, the tech stack that matters, and the trigger that makes the buyer ready now. It also names disqualifiers, showing where the motion does not work. “Mid-market and enterprise companies” is a large address book with optimism attached.
Customer discovery interviews, pilot results, signed LOIs, and outbound meeting rates show whether there are real buyers who fit that profile.
The GTM motion must then match that buyer and price point, whether it is PLG, sales-led, or hybrid. A sales-led motion for a very low ACV product, or a PLG motion for a very high ACV product, raises a mismatch investors will notice. Results from the outbound sequence, trial-to-paid conversion, and themes from discovery interviews show why the chosen approach makes sense. Messaging tests belong in the room through reply rates, meeting rates, and logged objections. Objections are particularly useful because they reveal where the message broke and what informed the next iteration.
Sequencing the marketing narrative so each metric answers the question the previous one raises
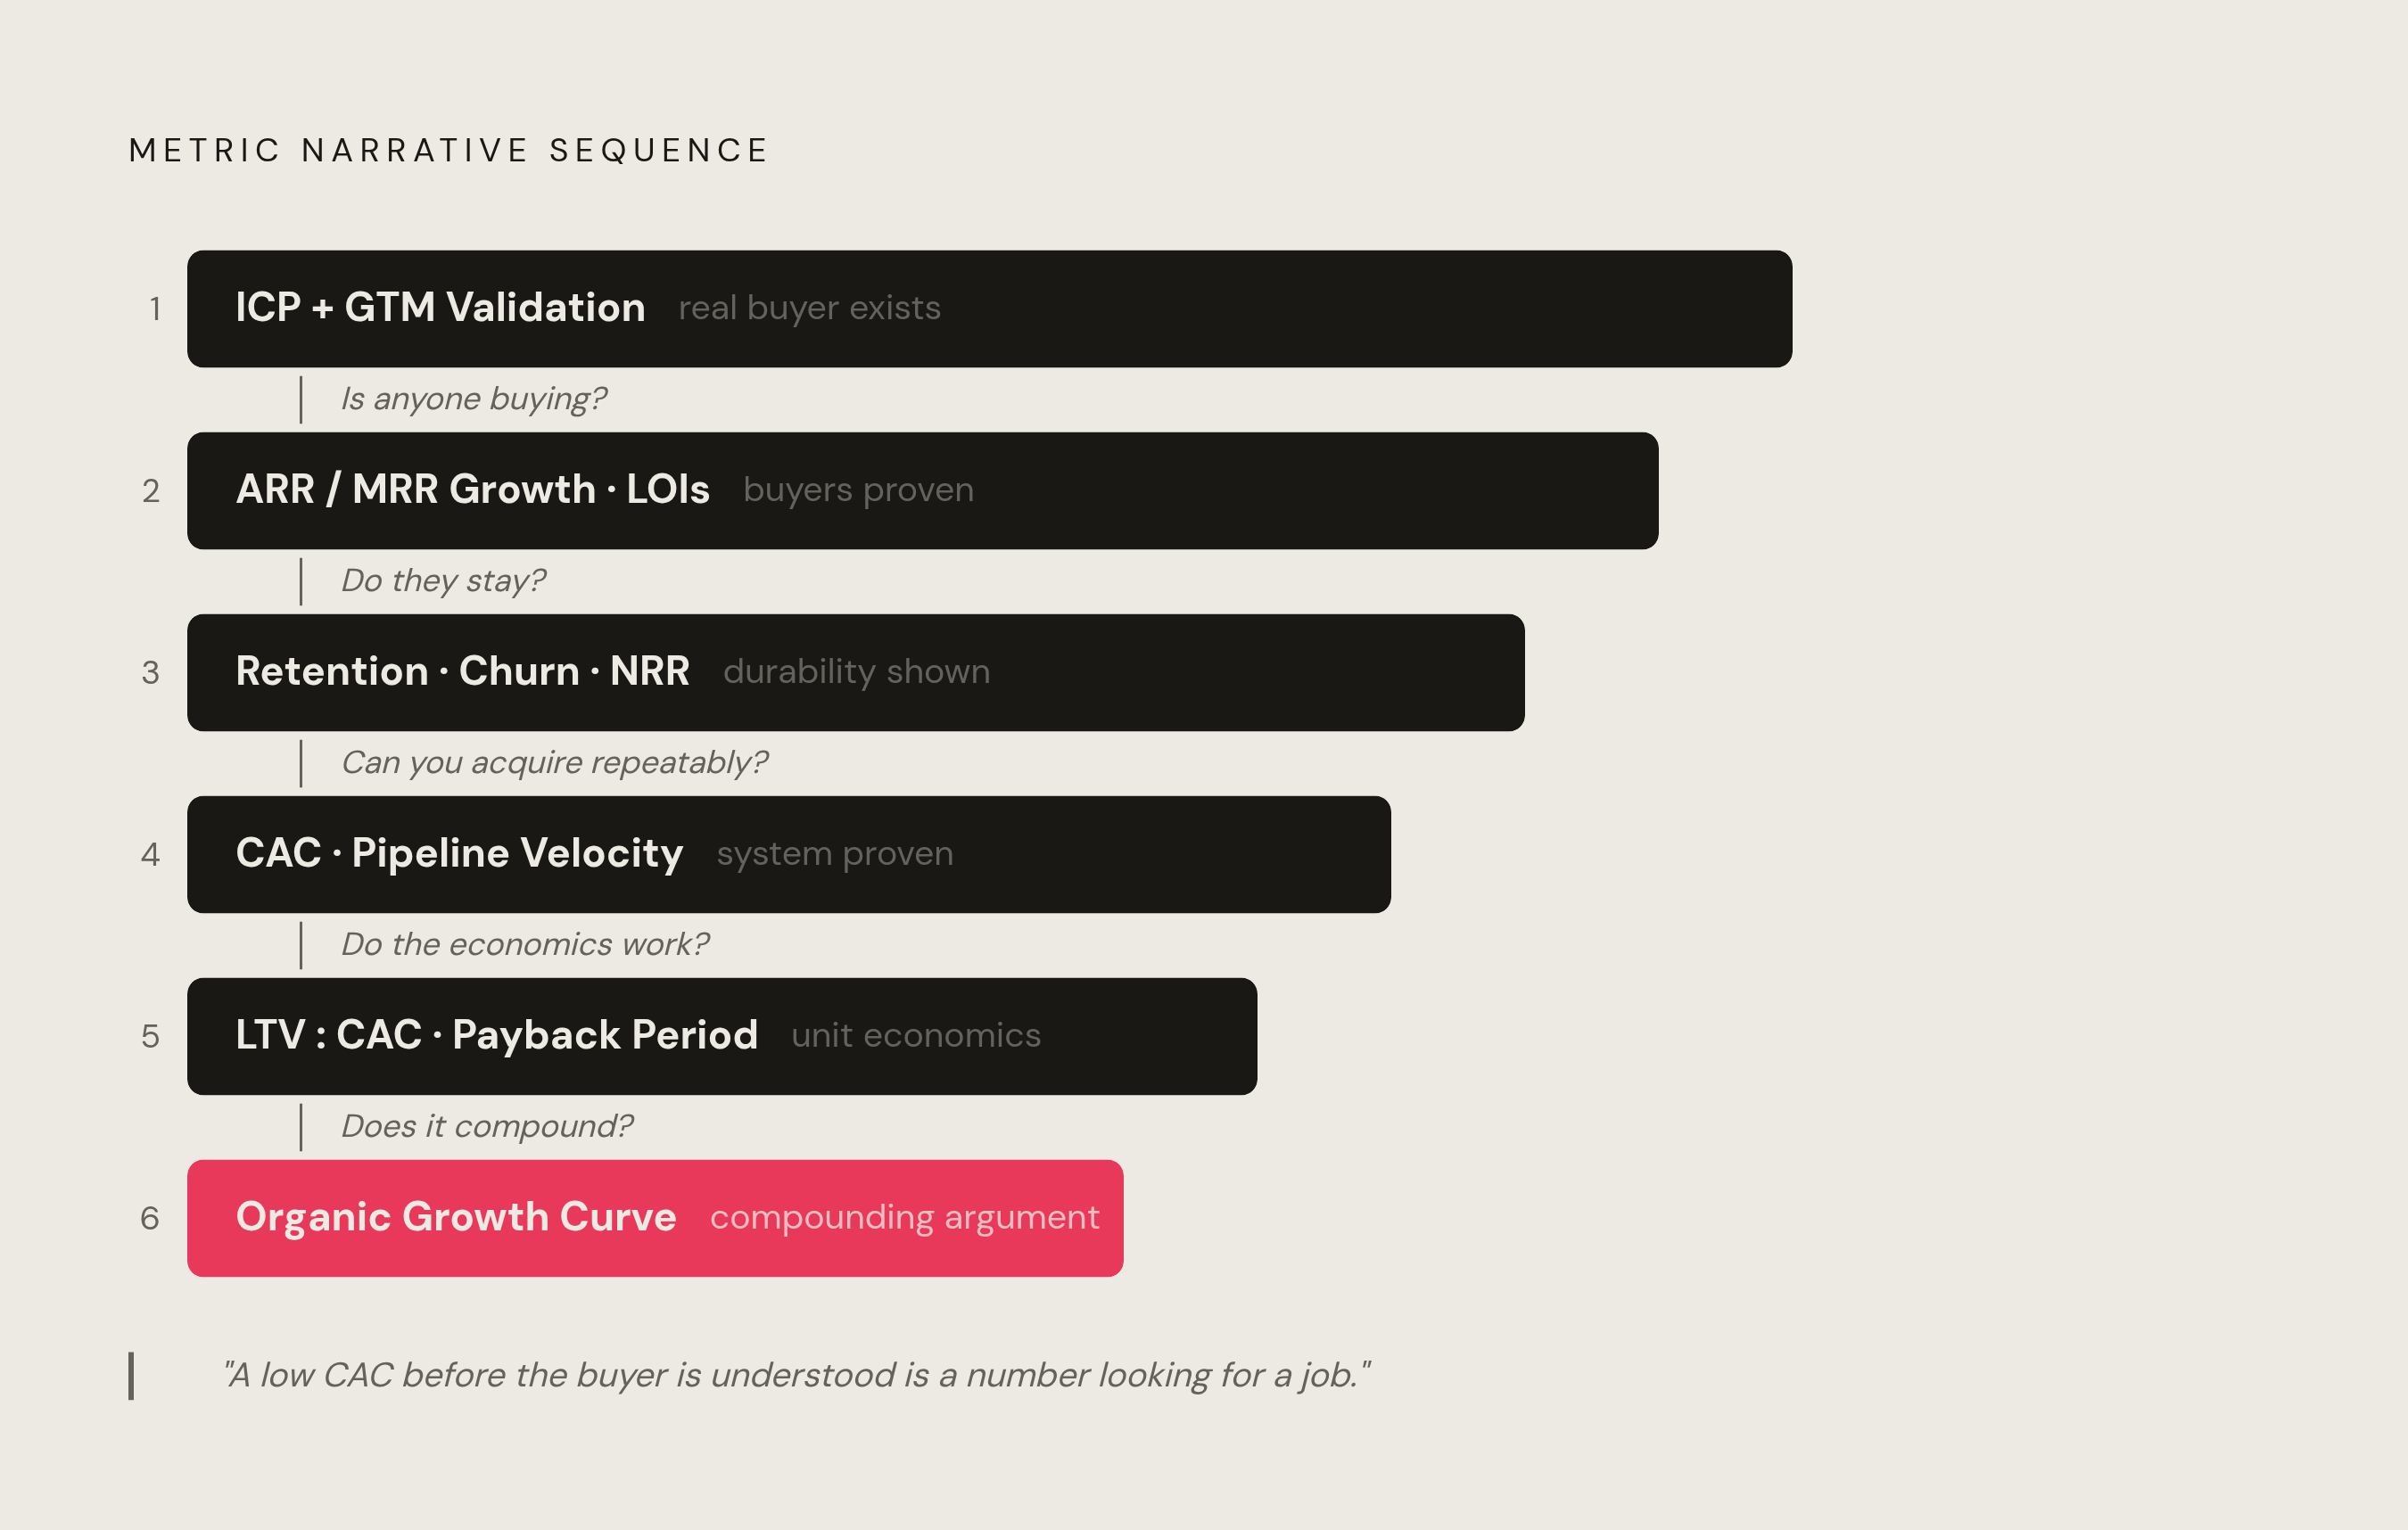
The evidence should follow the investor’s reasoning. Begin by establishing a real buyer through the ICP and its validation. Then show that someone is buying through ARR or MRR growth, LOIs, or pilot results. Once there is proof of demand, retention, churn, and net revenue retention show whether those customers stay. That progression turns separate observations into a case.
The next step is to show that acquisition can extend beyond the founder’s own effort. Channel-level CAC, pipeline velocity, and conversion rates establish whether there is a repeatable system. Only then do LTV relative to CAC, payback, and the organic growth curve make the compounding argument. A low CAC presented before the buyer is understood is a number looking for a job. Good sequencing gives it one.
The summary tab or traction overview should put the strongest signal first and provide a clear route to its supporting evidence. It can roll up total customers, recognized and contracted revenue, growth rate, and the top-line measures cited in the deck. That overview should keep the slide concise. Close the marketing evidence with pipeline by stage, honest win rates, and channel-level CAC trends.
The reconciliation standard — why every number must tie across every document
A mismatched ARR figure can make an investor question every other number in the room. An asynchronous reader’s uncertainty over whether a discrepancy is a typo or a misrepresentation makes reconciliation a credibility signal, even though most discrepancies are unintentional. The ARR or MRR on the traction slide must match the operating model’s summary tab and the customer cube. The CAC in the deck must match the model’s channel-level calculation, and what the memo says about growth must match the monthly data.
The fix is a reconciliation pass before sharing the room. Build the summary tab from the same source data used by the other documents, rather than manually typing fresh versions of the figures. Have a second person read the deck, model, and one-page memo in sequence, checking only numerical consistency. Include the funding ask in that pass so it agrees with the financial model. This takes hours and removes a reason for an interested investor to stop.
Building the marketing data room as an ongoing investor update, not a one-time document
After the seed round, the same evidence becomes the basis for investor updates. A monthly or quarterly update that carries CAC, pipeline velocity, and MQL-to-customer conversion in a consistent format makes progress legible over time. But consistency must reach below the layout. A CAC calculated differently in month 3 and month 9 cannot support a credible trend. Define CAC, LTV, MQL, and pipeline stage criteria from day one, then hold to those definitions.
The marketing operation should generate the evidence as it generates growth. Keeping track of pipeline, channel-level acquisition costs, conversion, and customer value gives the data room what it needs without having to piece it all together at the last minute. An embedded marketing team such as Pier is one option for founders who need execution and measurement built into the same workflow. It can help systematize those numbers so the deck, pipeline, and operating model describe the same marketing engine.
For founders without that engine, the time to build it is immediately after closing the seed round, before reaching the point six months before runway runs out. Each update adds another period of comparable evidence. By the next raise, the seed data room has become the foundation of a Series A argument, showing not just that growth happened, but how it became repeatable.