Retention Metrics as Traction Evidence for Investors
Stable retention curves now matter more to seed investors than signup spikes or revenue size.
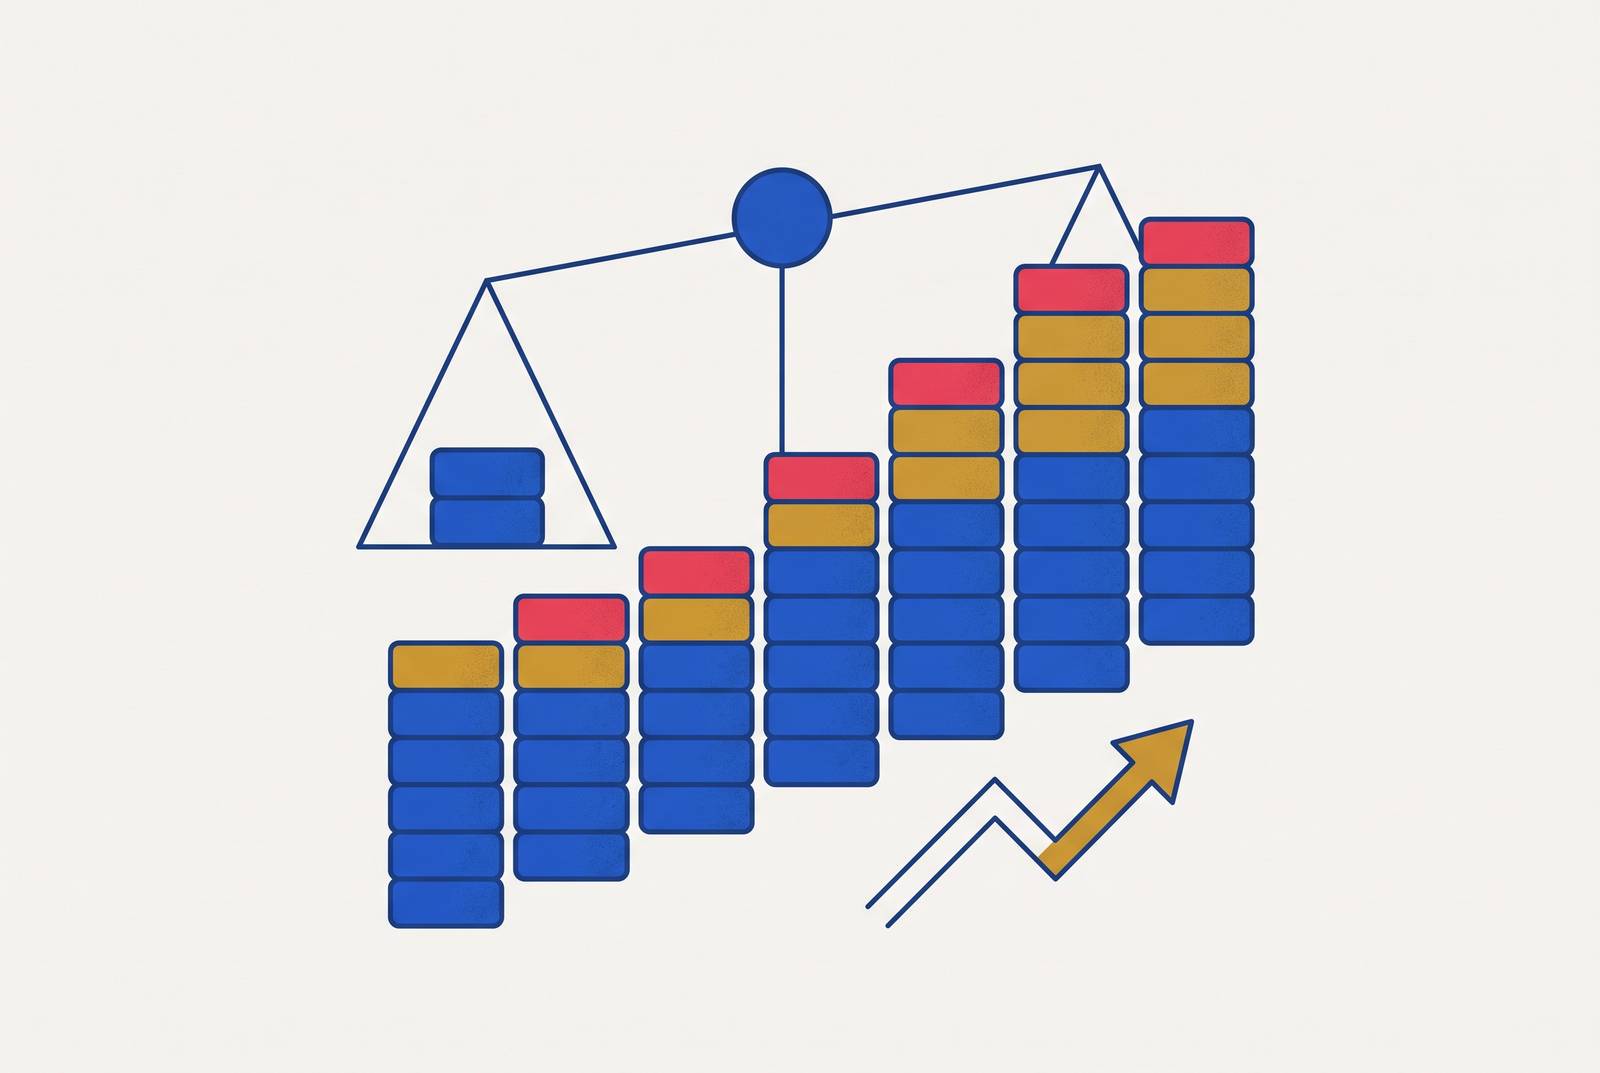
Seed rounds now get diligenced like Series A rounds used to be. Investors want proof before they write a check, not just a good story about where the market is headed. Retention metrics have become the clearest way to show that proof, because they can't be faked the way early signups can. Vision still gets a hearing, but only after the retention curve backs it up.
The logic behind this shift is simple. Any founder with a marketing budget can spike signups for a month. What nobody can buy is a customer who keeps showing up in week eight. That's why investors see a stable or improving retention curve as a behavioral signal of product-market fit, not as a trailing number that just confirms what they already believed. CRV's 2026 framework spells out the order of operations at seed: founder conviction gets evaluated first, qualitatively, but the first quantitative test is retention cohorts and engagement depth. Raw signups or total user counts barely register next to that.
CRV also names the shape investors hunt for: what they call the smile curve. Usage drops off early, but then it flattens into a steady line of customers who keep using the product. Revenue size has stopped being the flex it used to be, too. If a smaller batch of recurring revenue is diversified and holds steady, it reads better than a bigger spike that vanishes the moment one client walks.
The three retention metrics that carry the most weight in a seed-stage pitch
Three numbers do most of the work in a seed-stage retention conversation: monthly churn rate, net revenue retention, and cohort depth. Each one answers a different question investors are silently asking.
Monthly churn rate shows whether customers are sticking around. Churn climbing above threshold gets treated as a flashing PMF warning, not a minor operational hiccup. If monthly churn climbs above 5%, investors treat it as a signal that demands hard questions.
Net revenue retention, or NRR, answers a different question: are the customers who stay also growing? NRR measures the percentage of recurring revenue kept from existing customers once upgrades, downgrades, and churn get factored in. You also need gross revenue retention, since it strips out expansion and caps at 100%, giving the floor underneath the NRR figure. CRV notes that median GRR for private B2B SaaS is in the high-80s to low-90s, and the strongest companies reach the mid-to-high 90s.
Cohort depth shows whether retention is getting better or worse over time. If you look at how groups of customers acquired in the same period behave later, you can see whether retention improves, holds steady, or slides across generations of customers. When expansion MRR outpaces churn MRR, the existing customer base is growing the business on its own.
Current Benchmarks for Seed-Stage B2B SaaS
In 2026, seed-stage B2B SaaS retention numbers fall in a band so narrow you can tell quickly which side of it you're on. Knowing where in that band a pitch lands determines how investors read it, more than memorizing every figure in it.
On churn, the direction of travel changes how investors read the raw number. A founder whose churn is climbing toward or past 5% monthly has a problem to address before the first slide on growth.
Benchmarkit data puts the median NRR for private B2B SaaS and AI-native companies at 102%. The gap between those two medians is the room a company has to grow into as it scales past seed. Pricing model shifts the comparison too: Benchmarkit's 2026 numbers show usage-based pricing produces higher NRR than seat-based pricing, so a founder on usage-based pricing should measure against that peer group.
Series A is the number founders are building toward. Retention quality is the lever that lets a founder argue for landing at the top of that range. That small dip signals the bar on pure churn prevention has tightened, not loosened.
Burn multiple, net cash burned divided by net new ARR over the same period, is worth tracking alongside NRR because the two describe the same underlying thing from different angles: how efficiently the revenue base is being built and kept.
What strong and weak retention signal in investor due diligence
Retention data cuts both ways. The same numbers build investor conviction when they're strong, but get flagged first in diligence when they're weak, and investors are trained to spot both.
Strong retention tells investors the product found customers who actually need it, not customers who were just willing to try it once. Expansion MRR that outpaces churn MRR says something stronger still: the product delivers more value over time, which is a different claim than simply holding onto customers at a flat spend level. Organic referrals, customers bringing in other customers with no incentive attached, get treated by CRV as a behavioral PMF indicator precisely because no amount of ad spend can manufacture them. A company with one customer representing 40% of ARR carries a very different renewal risk than a company with a spread-out customer base, even if both report NRR above 100%.
Weak retention exposes itself in a few predictable places. Self-serve products get flagged specifically when retention is weak past month three, because no human relationship compensates for a product that isn't sticky on its own. Month-to-month contracts look worse to investors than annual or multi-year deals, because they introduce volatility into the revenue forecast no matter how strong NRR looks on paper.
If you have a small customer base, you often worry the numbers aren't statistically meaningful yet. CRV addresses this directly: a small set of passionate, paying, unaffiliated customers counts as real evidence at seed. The word unaffiliated carries the weight here, because if customers are friends or former colleagues, they don't prove the value proposition works for the actual addressable market. If a customer base is small but keeps growing, it beats a bigger one that's gone flat, because investors are pricing in trajectory.
Segmenting retention data for a richer story than a headline number
A single retention number is a headline, not the full article. Founders who present well break that number apart to show which customers stay, why they stay, and what that pattern says about the product.
Segmenting by acquisition channel is one of the sharper cuts available. Channel-level cohort data lets a founder show investors not just what NRR is, but which channels are actually producing the customers worth keeping.
Segmenting by customer size and tier tells a related story. Enterprise and SMB cohorts typically show different retention shapes, and Qubit Capital's documentation of the gap shows premium-tier customers deliver substantially more value than basic-tier customers. Surfacing that split lets a founder argue that the ICP they're focused on is also the ICP with the best retention economics, tying a product decision directly to a number an investor already cares about.
Decomposing MRR into new, expansion, churn, and contraction pieces turns the core NRR narrative from an abstract claim into something visible on a slide. SeedScope frames this decomposition as the question an investor is asking: how much of the revenue is new versus expansion versus churn, and whether the business depends on one giant customer or a spread of many smaller ones. So that breakdown signals a level of analytical maturity that a single NRR figure can't convey on its own.
Cohort curves do more work than a point-in-time snapshot. A founder who can show that customers acquired six months ago retain better than customers acquired a year ago is demonstrating something investors value almost as much as the product itself: the team is learning and iterating.
Using retention data to identify the ICP to double down on before Series A
Segmented retention data is the clearest signal a seed-stage founder has for deciding which customer type to go all in on, and doubling down on the right one is itself a retention strategy. The mechanism works in a straight line: customers who retain the longest and expand the fastest define the ICP with the strongest product-market fit, and the channels that brought those customers in define the go-to-market motion worth scaling.
Channel matters enormously here. Salesfully's go-to-market analysis puts inbound close rates at 50%, against 10% for outbound, with the gap driven by readiness. Inbound prospects show up already educated on the problem, but outbound prospects start cold, so you need to convince them from scratch. So that close-rate gap compounds into a retention gap too: customers who arrive already understanding the fit tend to stay longer than customers who got talked into a trial.
If you have a small customer list, you sometimes assume you don't have enough data to draw real ICP conclusions. CRV's answer to that worry: a small group of retaining, expanding customers, as long as they're unaffiliated with the founder, counts as meaningful evidence of fit. The goal at this stage is finding the pattern in who actually sticks around, and building the next hundred customers to look like them.
Why founder-led sales eventually breaks as a retention model
Founder-led sales works early on because you bring built-in authority, deep product knowledge, and the flexibility to bend pricing on the spot. Customers trust the person who built the thing, and that trust appears in early retention numbers. The same concentration of trust that makes founder-led sales effective in the first ten deals is what makes it collapse once the customer count climbs. Mental Momentum's research on founder-led marketing lays out the math: scaling the customer base multiplies the number of sales meetings required far beyond what a single calendar can hold, and growth flattens out because every ounce of trust still runs through one person.
Uplift GTM's framework documents how this plays out in five stages. In the first stage, with zero to ten customers, the founder is selling, learning, and iterating toward product-market fit. From ten to thirty customers, the founder is scaling a pitch that has started to repeat reliably. Between thirty and fifty customers, the first sales hire comes on, and the job becomes documenting the process well enough to prove someone other than the founder can close a deal. From fifty to a hundred customers, you build out a full team of reps. Past a hundred customers, a VP of Sales owns the revenue function outright and the founder steps back from closing.
That transition isn't free. Over two to three quarters, a strong hire typically closes that gap back to within 10% to 15% of what the founder was pulling off solo. Systematized marketing, built on content, email, and SEO, produces inbound customers who arrive already a strong fit. That higher initial fit is the raw material behind the retention metrics investors expect to see by the time Series A conversations start.
Framing retention metrics as a forward-looking growth narrative in the pitch
Retention metrics only pay off in a pitch when they're framed as evidence of a growth engine still building momentum, not as a report card on what already happened. The move is from describing what occurred to explaining why it keeps compounding.
Start with the shape of the curve, not the headline number. The first thing a retention slide should show is the curve itself, with the smile shape CRV describes front and center: early drop-off, then a flattening into steady use. That stabilization point is the actual PMF signal, more than any single percentage next to it.
From there, connect retention directly to the expansion engine. NRR above 100% isn't just a retention statistic, it's the argument that existing customers will help fund future growth without additional acquisition spend. Decomposing MRR to show expansion outpacing churn makes that compounding argument concrete. The VC Corner's analysis points to Slack's 132% NRR and Zoom's 140%-plus NRR, both drawn from their S-1 filings, as the anchors investors keep in the back of their minds. No seed-stage founder needs to match those numbers, but if the trajectory points that way, it does real work in a pitch.
Retention also feeds directly into the CAC efficiency argument. Customer acquisition costs rose in 2025, so expansion revenue from existing customers is now the most capital-efficient growth path for most companies. CRV's Series A framework sets the LTV:CAC floor at 3:1, with the strongest performers landing well above it, and retention is the force driving LTV in that ratio. CAC payback for private SaaS companies typically runs around 20 months according to CRV, and a founder with strong NRR can make the case for a faster effective payback, since expansion revenue from retained customers shortens the real recovery window.
Finally, you should show that retention data shaped a deliberate decision about who to pursue next. Investors want to see more than customers staying, they want to see that the founder knows which customers stay and has pointed the go-to-market motion at finding more of exactly that type. That sequence, retention data leading to ICP clarity, leading to a scalable acquisition motion, leading to a predictable pipeline, is what investors are listening for before a Series A check gets written. A few habits undercut this narrative fast: leading with a single NRR number and no cohort curve behind it reads as a claim without evidence, and presenting retention in isolation from the GTM motion leaves the real investor question unanswered, which isn't just whether customers are staying, but whether the founder can explain why and repeat it on purpose.