LTV to CAC Ratio Benchmarks for SaaS Startups
Apply the 3:1 rule by stage, not as gospel.

LTV to CAC has one job: tell you if the dollars spent to win a customer come back with friends. David Skok's 3:1 rule has run the SaaS playbook for over a decade, and most people quoting it have no idea it was built on Salesforce, HubSpot, and NetSuite data: mature public companies with years of stable churn and payback periods under 12 months. Applying that number to a seed-stage startup is like grading a first-year resident against a chief surgeon and docking points for the same mistakes.
Skok built the framework around 2010 at Matrix Partners. Pairing it with a payback horizon came next, because the ratio was never meant to stand alone, not even for the mature companies it was built on. Somewhere along the way that got lost, and 3:1 turned into a universal law applied at every stage, whether or not the company had found product-market fit yet. Treat 3:1 as a direction to walk toward, not a grade. It is not a number a board should write anyone up for in month nine, and any board that does hasn't read the fine print on where the number came from.
What the ratio actually measures, and the calculation mistakes that corrupt it before benchmarking begins
LTV to CAC compares gross-margin-adjusted customer lifetime value against fully loaded acquisition cost. The standard B2B SaaS formula:
LTV = (ARR per customer × gross margin %) ÷ churn rate
For companies with real expansion revenue, swap in NRR instead: LTV = (ARPU × gross margin) ÷ (1 − NRR). That version captures the upsell and cross-sell dollars a flat-churn formula throws away.
Most founders trip on step one: they use revenue instead of gross margin. That overstates LTV by a meaningful margin, depending on how wide the margin gap runs. Not a rounding error. That's the difference between a ratio that gets a company funded and one that gets a founder a follow-up question nobody can answer in the room.
CAC has its own landmines, and here's the part people miss: the number gets manipulated in both directions. Fully loaded CAC includes ad spend across every paid channel, sales rep salaries and commissions, SDR costs, marketing tools, agency fees, content production, event costs, and the slice of customer success spend tied to onboarding. Count only ad spend and skip the rest, and CAC comes out 1.5 to 4 times smaller than it should. Leave out sales rep comp specifically, and for sales-led B2B motions, CAC gets understated by 20 to 60%.
Here's where to plant a flag: undercounting is the more dangerous error, because it inflates the ratio right up until an investor's diligence team takes it apart line by line, and by then the damage is done. Overcounting (folding in product development or long-term customer success work that has nothing to do with acquisition) just makes a business look weaker than it is, which is a survivable mistake. A suspiciously great ratio means something got left out. A suspiciously bad one means something snuck in that doesn't belong.
Stage-by-stage benchmarks: what a healthy ratio actually looks like at seed, growth, and scale
Optifai's study of 939 companies (Q2 2025 to Q1 2026) puts the median B2B SaaS LTV to CAC at 3.2:1. That number is fine and almost useless on its own, because it blends seed-stage startups with companies doing nine figures in ARR. That blend is exactly what convinces early founders they're behind schedule when they aren't.
Seed and pre-Series A (under a few million in ARR). A ratio below 3:1, often 2:1 to 2.5:1, is normal here, not alarming. Payback should sit under 24 months, with under 18 preferred. NRR should be at or near parity for SMB-focused companies, and gross retention below the mid-80s is a genuine red flag. VC-backed seed companies can get away with 1.5:1 to 2:1 if the number is trending up quarter over quarter, because investors watch the slope of the line, not the dot itself. A company sitting at 2:1 but climbing beats one frozen at 3:1 for a year straight.
Growth stage, Series A to B ($2M to $10M ARR). The target range shifts to 3:1 to 4:1, and 3:1 has quietly become the floor rather than something to celebrate. Payback compresses to a 14 to 16 month median: PLG companies at Series A land around 16 months, sales-led Series B companies closer to 14. NRR should clear 106% (the all-B2B 2026 median), with top-quartile companies at 120 to 125%. Investors now ask for 4:1 or better, broken out cohort by cohort rather than smoothed into one company-wide average.
Scale, Series C and beyond (above $10M ARR). Target range runs 3.8:1 to 5:1 and higher, with top-quartile companies pushing well above that, with payback periods compressing significantly at this stage. NRR floor sits at 118% for enterprise, with the top quartile again at 120 to 125%.
The pattern holds at every stage: ratios climb and payback periods shrink at the same time. That combination, tighter payback plus a stronger ratio, is what separates efficient growth from the kind that quietly drains a balance sheet. One wrinkle before anyone gets too excited about a big number: a ratio above 5:1 that keeps climbing isn't automatically a victory lap. Just as often, it means a company is underspending on acquisition and leaving growth sitting on the table, which is its own kind of mistake, just a quieter one.
Why the ratio lies without CAC payback period beside it
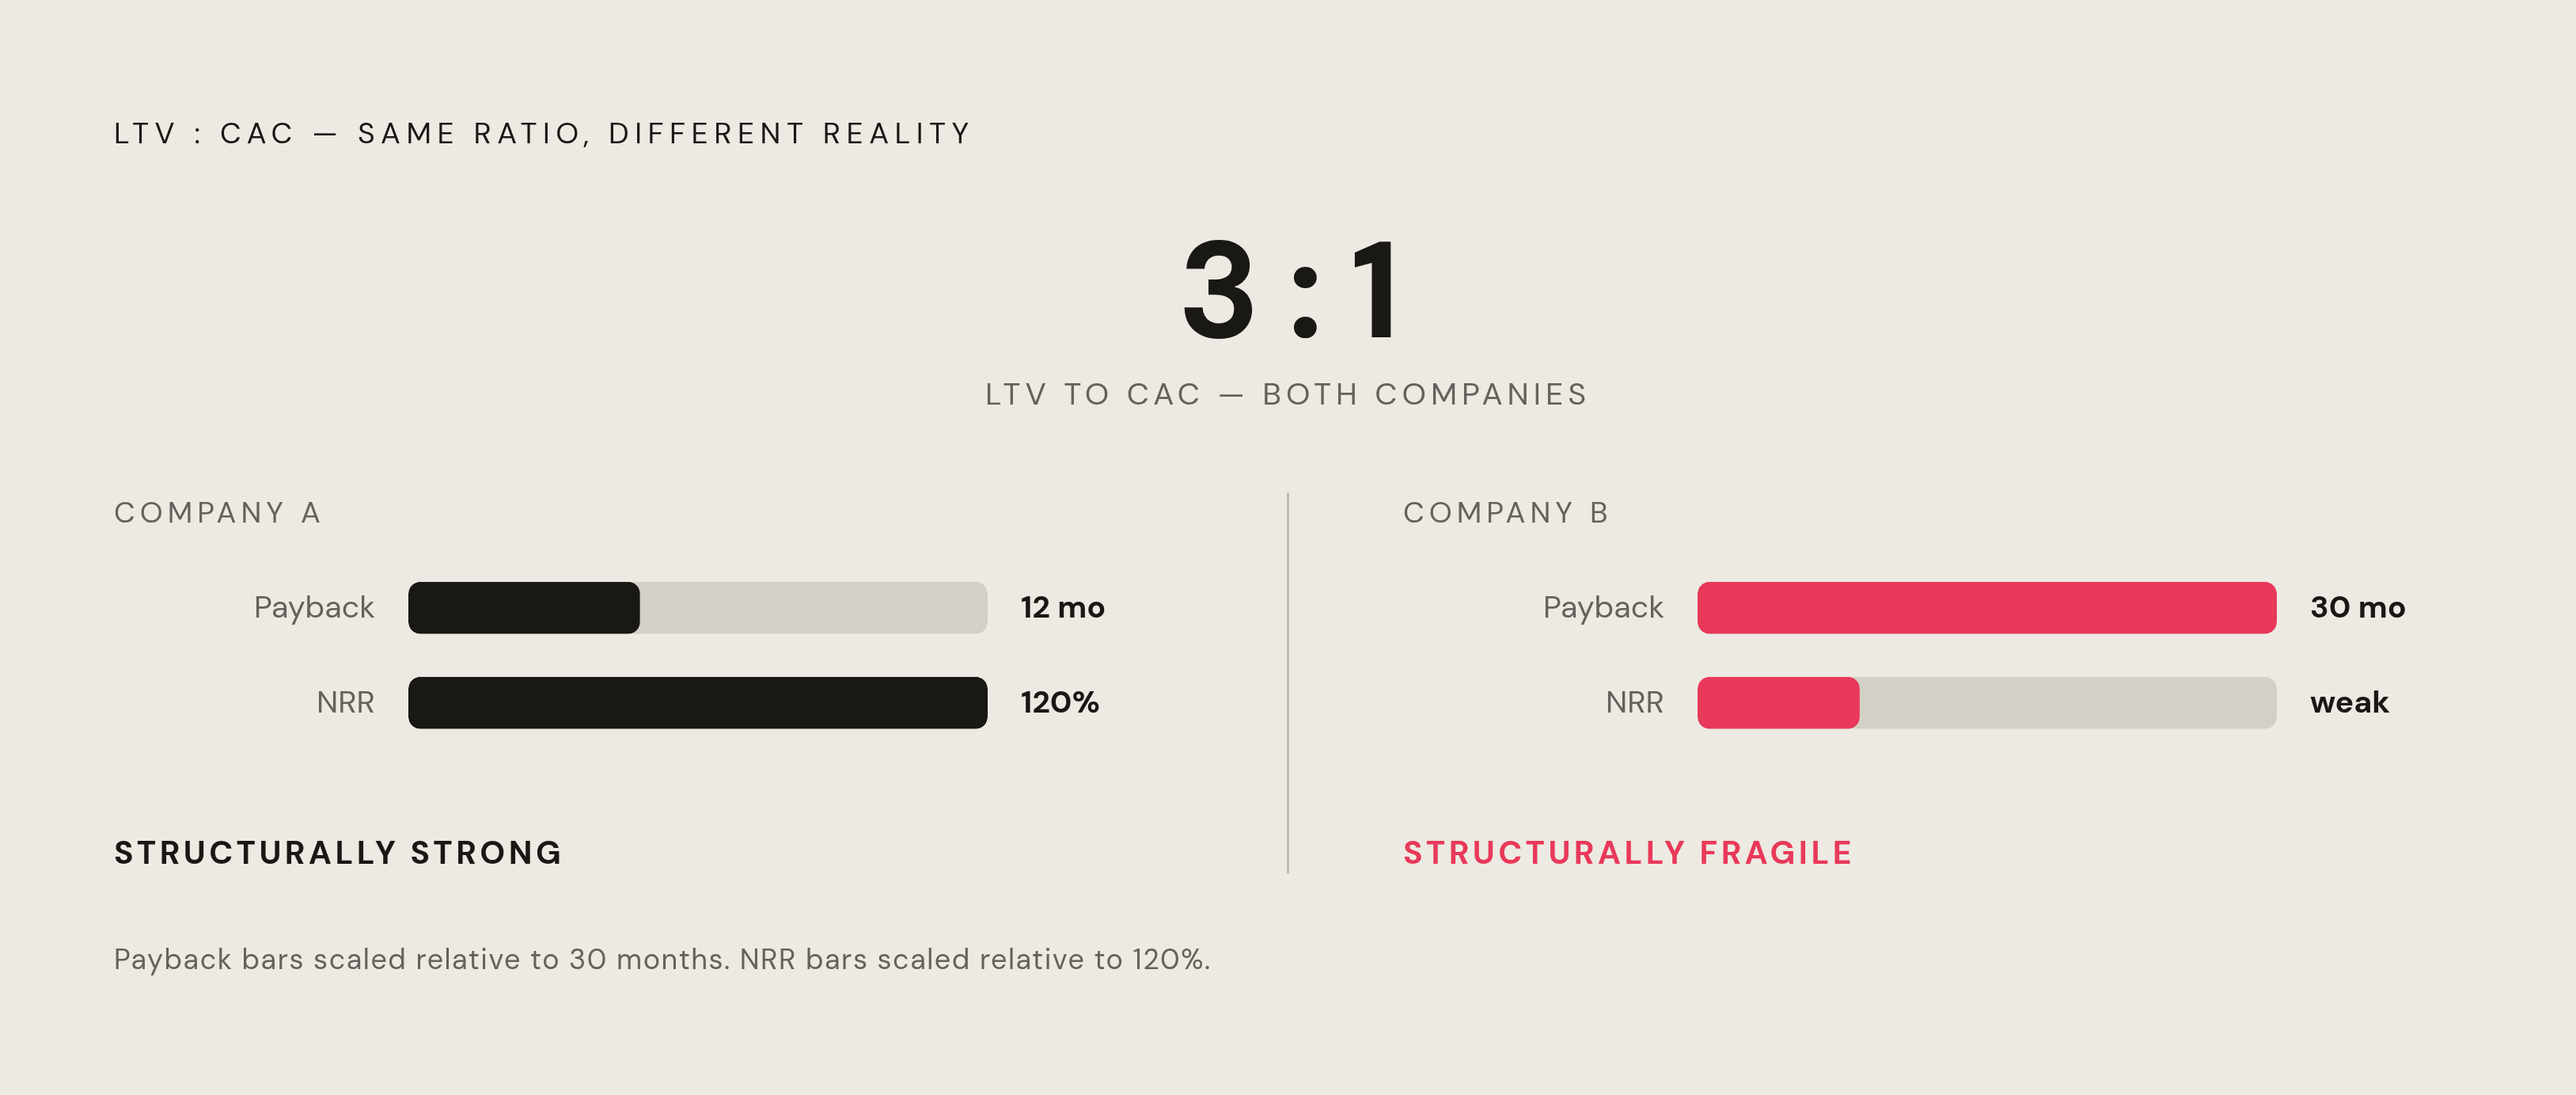
LTV gets calculated over a customer's entire relationship with a company, which can stretch years. A gorgeous ratio can sit right next to a cash problem that won't show up on the dashboard for a long time. For a startup running on a finite seed round, a long payback period isn't a nuance to footnote. It's a liquidity problem wearing a nice suit.
Take two companies, both sitting at 3:1. One has a 12-month payback and 120% NRR, genuinely strong. The other has the same 3:1 ratio but a 30-month payback and weak NRR, structurally fragile no matter what the top-line number claims. Same ratio, two completely different businesses, and only one of them survives a rough fundraising quarter.
Payback periods have actually been improving. Recent data shows the median dropped from 18 months in 2024 to 16 months in 2025, an 11% improvement in a single year and the largest single-year gain in four years of tracking. The 25th percentile fell from 12 months to 10. Top quartile sits at 6 months or under, bottom quartile at 24 or worse, and the single worst case in the sample hit 48 months. The gains came from tighter go-to-market spend and better targeting, not from throwing more money at the problem. Boring detail. Also the one that actually matters.
Payback tracks deal size closely, too. Very small ACV deals pay back in around 9 months. Mid-range ACV runs 14. Above a high six-figure ACV, payback stretches to 24 months, since enterprise sales cycles and onboarding just take longer to recoup.
For seed and Series A companies, under 12 months is the number to aim for, and at the Series A stage in particular, anything over 18 months is a deal-breaker no matter how fast the top line is growing. TestGorilla raised a $70M Series A on the back of an 80-day CAC payback period during a hyper-growth stretch, about as clean a demonstration as exists of what top-quartile payback buys a founder in a fundraising conversation.
Payback answers the question the ratio can't: how long does the cash actually stay locked up before it comes back?
How NRR completes the picture the ratio and payback period can't finish alone
NRR is the correction factor missing from the basic LTV formula. If customers expand their spend over time, a standard LTV formula understates their real value. If customers contract or churn, it overstates it. The adjusted formula, LTV = (ARPU × gross margin) ÷ (1 − NRR), moves the ratio meaningfully for any company with a real upsell motion.
Stage benchmarks for NRR climb the same way the ratio does. At seed, 97% or above is the floor for SMB-focused companies, and gross retention under 85% means no amount of acquisition tuning saves the ratio. At growth stage, the all-B2B 2026 median sits at 106%, top quartile at 120 to 125%. At scale, enterprise companies should be at 118% or above, same 120 to 125% ceiling for the top performers.
Retention is the constraint that binds before acquisition even enters the conversation, and seed-stage founders are the ones who feel it first. Churn customers early and every CAC dollar gets wasted twice: once on the acquisition itself, and again on the LTV projection that never materializes, because the customer left before the model's math had a chance to play out.
There's a valuation story tied to this too. Rule of 40 companies command a 129% valuation premium, up sharply from 23% in 2022, and NRR sits at the center of that efficiency narrative. It's also why investors increasingly demand cohort-level LTV to CAC instead of one blended figure: NRR only means something at the cohort level. Track all three, ratio, payback, NRR, together from day one. Not sequentially, and not as an afterthought once the ratio starts looking decent.
The blended ratio problem: what a healthy company-level number can hide
A company-level ratio of 4:1 sounds healthy. It can also be hiding a 10:1 organic channel quietly subsidizing a 1.5:1 paid channel that's bleeding cash. The blended number looks fine on the slide. The capital allocation underneath it is broken, and nobody notices until the paid channel eats the runway.
Break the ratio out along three lines instead of one: acquisition channel (paid search, content and SEO, outbound, referral, partner), customer segment (SMB, mid-market, enterprise), and cohort vintage. A customer acquired in Q1 behaves differently than one acquired in Q4, for reasons that have nothing to do with the product itself.
Segment-level LTV makes the case on its own. SMB customers run $15K to $40K in lifetime value. Mid-market lands at $80K to $200K. Enterprise stretches from $300K past $1M. A seed-stage company selling into all three segments at once isn't managing one unit economics problem. It's managing three, simultaneously, each with its own answer to what a healthy CAC even looks like.
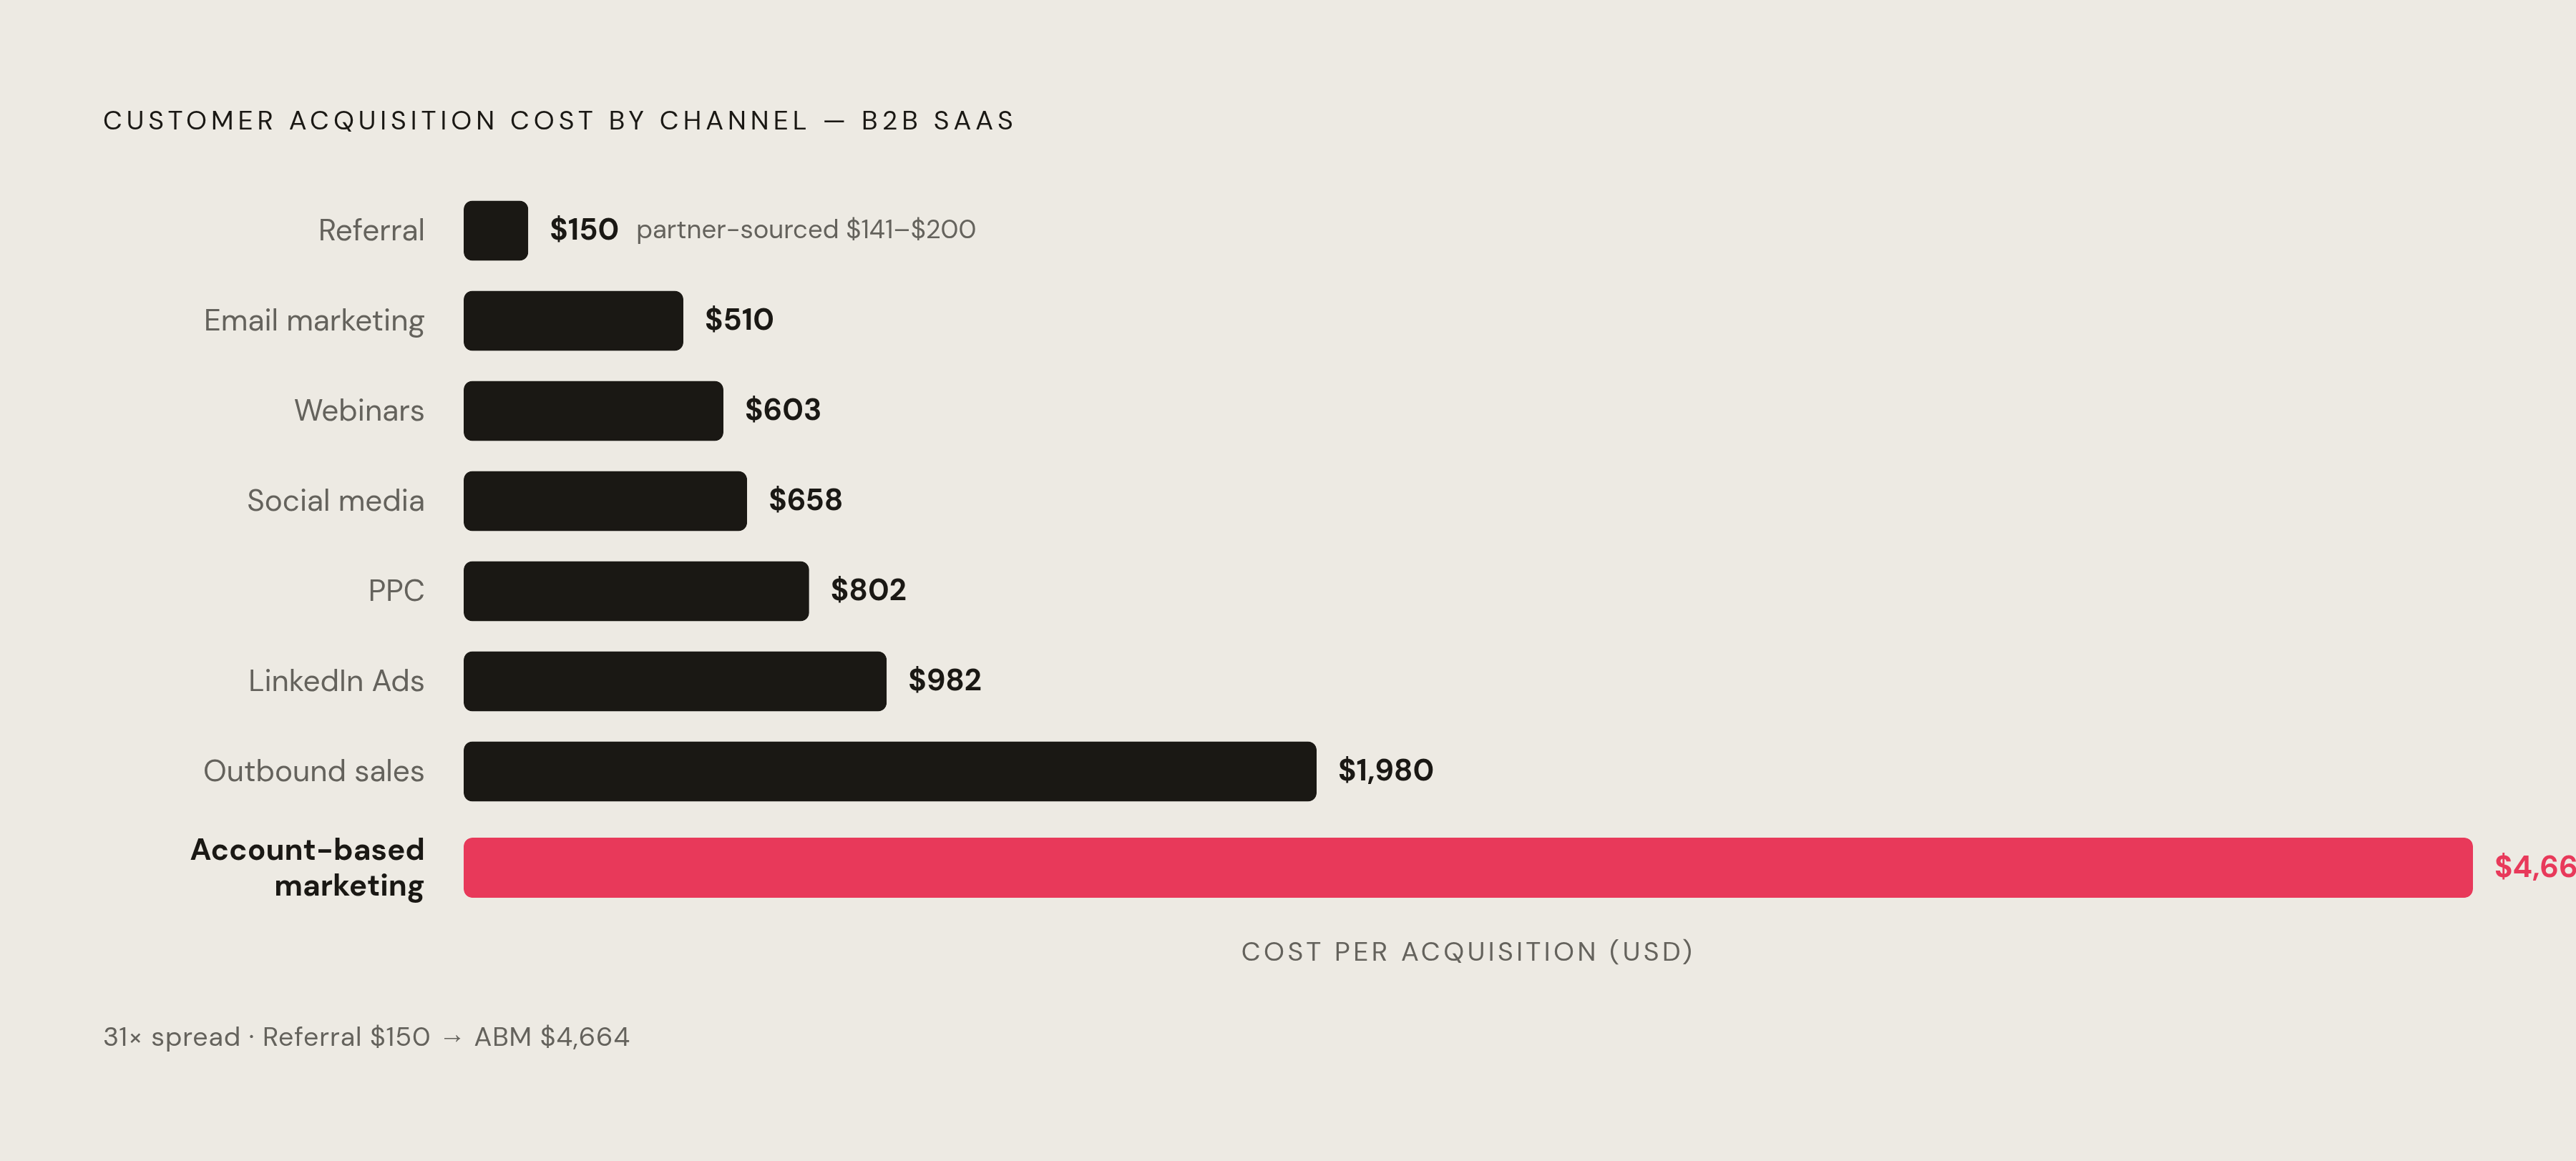
Channel-level CAC tells the same story from a different angle. Email marketing averages $510. LinkedIn Ads run $982. Account-based marketing hits $4,664. A single blended CAC number can be the output of wildly different channel mixes underneath it, and blending organic traffic with paid spend is a specific, common seed-stage mistake, one that can make paid acquisition look meaningfully cheaper than it really is. That figure isn't something every benchmark source agrees on, so treat it as a caution flag rather than gospel.
Segment before presenting the number to anyone. Cohort-level visibility is what investors expect now, and more usefully, it's what actually tells a founder where the next marketing dollar should go.
What rising CAC costs mean for the ratio, and which acquisition channels hold their economics
CAC has gone up 222% over the past eight years and jumped 40 to 60% in just the 2023 to 2025 window. Paid platform costs keep climbing, sales cycles keep stretching, and privacy regulation keeps chipping away at targeting precision. None of that is news to anyone running paid ads. The scale of the increase is the part worth sitting with.
Channel economics vary enormously, and the spread tells founders exactly where to put the next dollar. Referral programs average $150 CAC, the cheapest channel in B2B SaaS. Email marketing sits at $510, webinars at $603, social media at $658, PPC at $802, LinkedIn Ads at $982. Account-based marketing runs $4,664, and outbound sales tops the list at $1,980, though outbound earns its keep on large-ACV deals where the math is easy to defend. Most B2B SaaS companies fall in the $200 to $700 range overall, with mid-market and enterprise-focused motions running $1,200 to $2,000.
Partner-sourced customers are the quiet outperformer here: $141 to $200 CAC, 16% higher LTV, and four times more likely to refer someone else in. Only a small share of seed-stage companies treat partnerships as a serious channel today, yet most public SaaS companies lean on them heavily. That's a channel that compounds as a company scales, not one that peaks early and fades.
Product-led growth companies acquire customers at a meaningfully lower CAC than sales-led peers, and PLG leaders grew at more than twice the rate of traditional SaaS companies in OpenView's 2023 benchmarks. The model winning in 2026 is a hybrid: PLG to get people in the door, sales-led motion to expand the account once they're in. Worth watching too: AI Overviews now show up in roughly a quarter of US desktop searches, cutting into click-through rates and pushing zero-click search higher. Organic CAC assumptions built on pre-2024 SEO behavior won't hold up much longer.
Pick the channel, don't chase the fix. The fastest way to improve LTV to CAC at seed is not rescuing a broken paid channel through sheer optimization effort, and founders who try usually burn a quarter finding that out the hard way. Concentrate spend on the one or two channels where CAC is structurally lower and payback is already under 18 months. Let the broken channel go.
Sources
- LTV to CAC Ratio: Complete 2026 Guide for B2B SaaS
- B2B SaaS LTV Benchmarks — 939 Companies by Segment & LTV:CAC Ratio
- Best LTV to CAC Ratio Benchmarks for B2B SaaS in 2026
- LTV:CAC Ratio Benchmarks 2026 + Free 4-Quadrant Calculator | Foundry CRO
- LTV:CAC Ratio: SaaS Benchmarks and Insights - Phoenix Strategy Group
- phoenixstrategy.group
- burklandassociates.com
- LTV-to-CAC: Key SaaS Benchmarks Explained