Setting Up Marketing Analytics Before a Fundraise
Investors now demand the metrics and history that prove repeatable growth before you pitch.

Setting up marketing analytics before a fundraise builds the evidence investors need to back a seed or Series A round. The strongest story connects a defined customer, repeatable acquisition, retention, and sound unit economics. Within a 12–18-month runway, that evidence has to build as the business runs, well before the pitch deck needs better charts.
Why investors evaluate seed rounds differently now, and what that means for your analytics setup
CRV’s 2026 seed guide states, “Seed rounds now look like what Series A used to be”. By seed, investors want proof that customers use, pay for, and stick with the product. For B2B SaaS, that means meaningful recurring revenue, low annual gross churn, and demonstrable customer acquisition costs.
That shift means teams have to measure as they work, before fundraising begins. First-time founders without pedigree have to close the credibility gap with data, especially when traction is limited. Investors examine both momentum and the economics of producing it, and neither can be established by a launch-day spike. Confetti is not a cohort. Without an analytics layer already running, founders lack the history needed to distinguish repeatable progress from a good afternoon.
The specific metrics investors use to underwrite a seed or Series A round
Investors examine two connected categories, which are growth and product metrics, and unit economics. For B2B SaaS with paying customers, monthly recurring revenue and annual recurring revenue show how much the business is growing. CRV says early-stage companies tend to report MRR while annual revenue is still small because reports by month show progress more clearly. Revenue is not the only useful signal. For usage-based or consumer products, engagement measures such as the DAU/MAU ratio help show whether people come back.
Unit economics asks what that growth costs. The lifetime value to customer acquisition cost ratio, or LTV:CAC, indicates whether acquisition can be profitable in principle. CAC payback period shows how many months pass before a customer’s revenue covers their acquisition cost. Shorter payback signals capital efficiency, while SaaS gross margin provides the headroom for the economics to work. A growth rate without these measures leaves the cost of sustaining it unresolved.
The bar shifts with team credibility and market context, so founders need to understand what investors examine. Before revenue, the evidence hierarchy runs from paid pilots through signed Letters of Intent, active users, and an engaged waitlist, with paying customers strongest once they exist. For pre-seed B2B, specific LOIs show commercial intent more credibly than a large passive list.
Why analytics built after product-market fit confirmation produces usable trend data, and analytics built at pitch time produces nothing
Once product-market fit is confirmed, analytics needs to record whether that fit persists as acquisition grows. Investor-grade evidence is a pattern. A retention curve needs time to flatten, and 90-day retention cannot appear on day 30.
Payback has its own dependence on history. It requires a record of when a customer arrived, through which channel, at what cost, and how long their revenue took to cover that cost. Disconnected tools cannot reconstruct a measurement history that was never captured. CRV notes that raising seed funding takes most founders three to six months, so the analytics runway has to begin before the fundraising runway.
Tracking that begins at pitch time can produce current counts, but not the mature trends investors need. Starting tracking at pitch time leaves three gaps at once: too little growth history, retention data that needs more time, and acquisition costs that are not linked to results. Those gaps are missing evidence.
The instrumentation sequence: what to set up first, second, and why the order matters
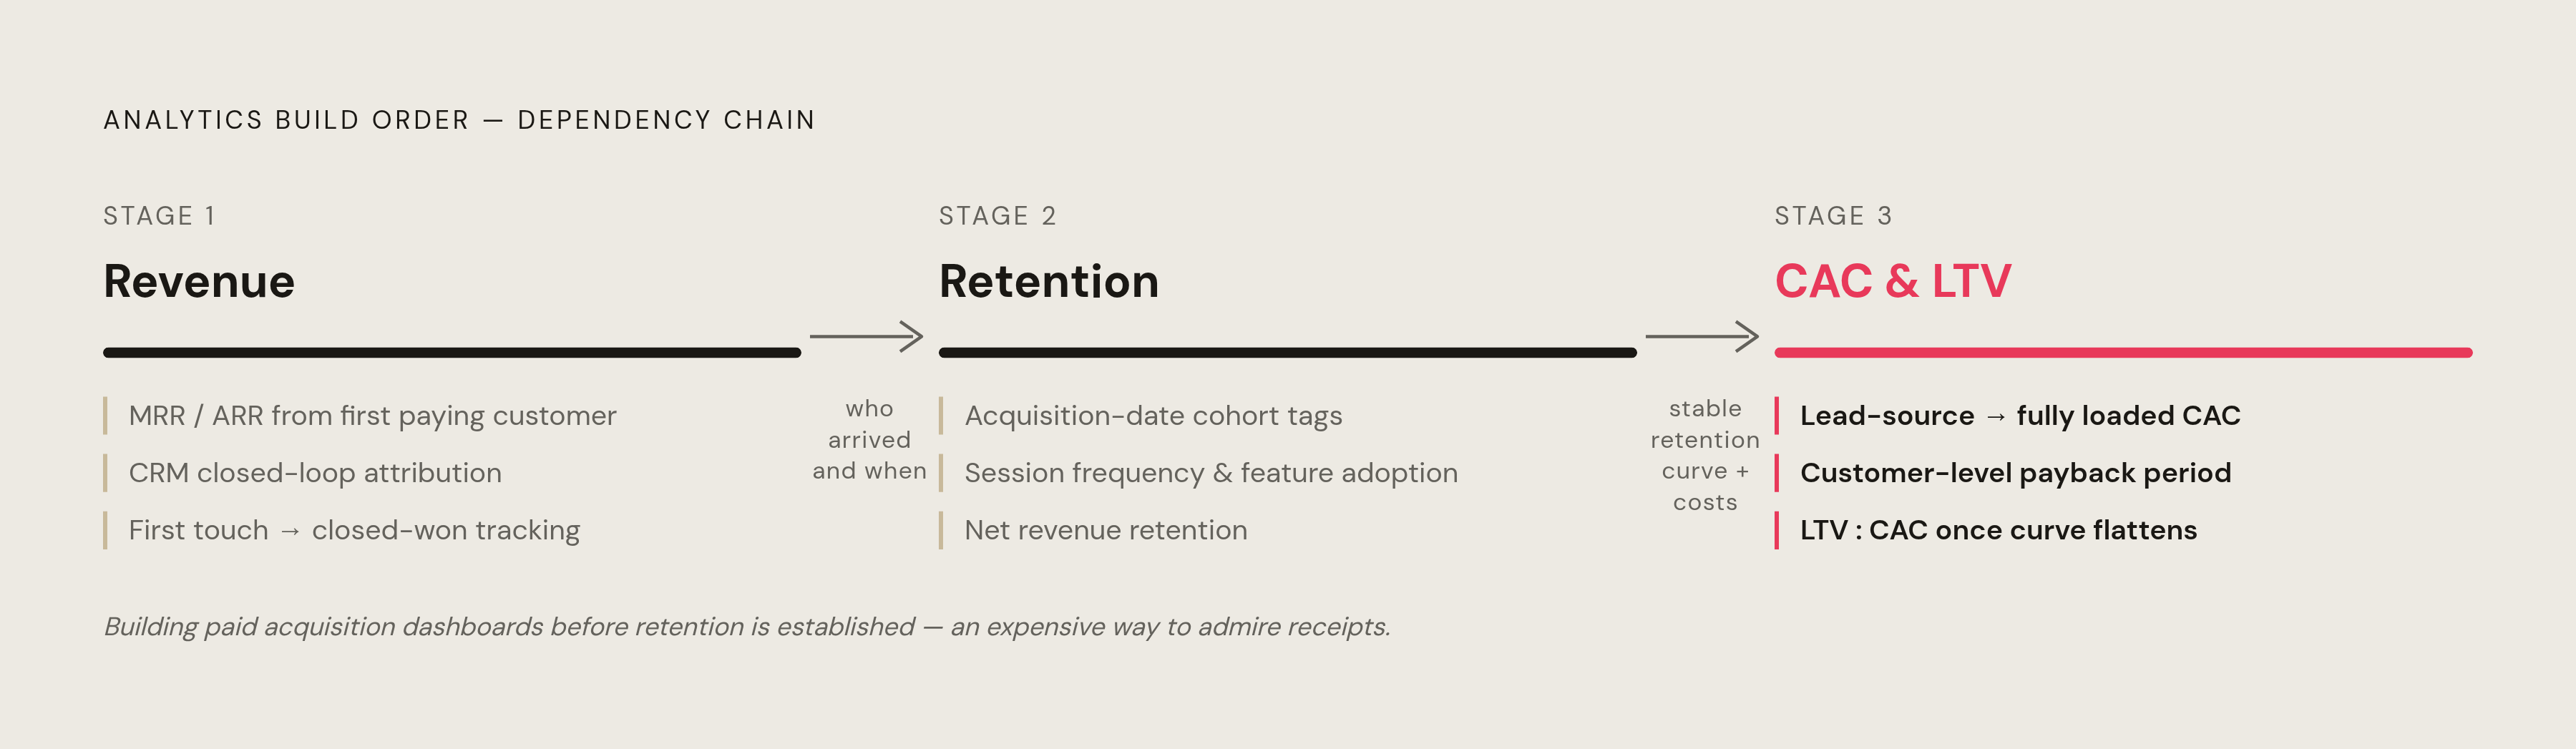
Start with revenue and pipeline instrumentation. MRR and ARR tracking should be live from the first paying customer, giving the primary growth measure an uninterrupted history. A CRM with closed-loop attribution from first touch to closed-won provides the foundation for linking acquisition activity to customers. Sales cycle length belongs here from the first deal, because it becomes useful across multiple deals over time.
Retention and engagement come second, immediately after that foundation. Every new customer or user needs an acquisition-date tag so cohort analysis can follow what happens to people who arrived together. Missing cohort history cannot be retrofitted into existence. Session frequency, feature adoption, and active-user measures then help show whether customers keep using the product. For B2B SaaS, tracking of account-level expansion and contraction must start as soon as there are customers so that net revenue retention can be measured.
Build the layer for CAC and channel analysis once acquisition channels are up and running. Lead sources need the same tags from the start so that comparisons over time use tags that mean the same thing. The third layer links those records to the fully loaded cost of acquiring customers, the channels they came through, and their acquisition dates. It makes customer-level payback calculable.
LTV:CAC comes later because its assumptions depend on retention. When the customer base is stable enough and the retention curve has flattened, estimates of lifetime value have more to back them up. The sequence is therefore a chain of dependencies. Revenue establishes the base, retention establishes its durability, and CAC establishes the cost of producing it. Starting with paid acquisition dashboards instead produces a detailed account of spending before there is evidence of durable customers, which is an expensive way to admire receipts.
How to instrument the pre-revenue stage when LOIs and engagement signals are the primary traction evidence
Pre-revenue founders still need to measure traction, using different evidence. Without revenue, the available evidence concerns commercial intent, demand quality, and the consistency of the difficulties customers face. Those signals can develop over time too. The task is to record them precisely enough that progress means more than a growing pile of names.
For B2B at pre-seed, track LOIs with a named company, stated price range, defined feature conditions, and a date. LOI velocity shows how quickly new commitments come in, while LOI-to-pilot conversion shows whether people who intend to use the product move toward doing so. Together, they provide an early version of pipeline velocity. A small number of strong LOIs can outweigh a much larger passive list.
For a waitlist, track update-email open rates, reply rates, and the share of members who match the ideal customer profile, or ICP. Acquisition source belongs in that record as well. Organic word-of-mouth and founder outreach to exact-ICP contacts show demand more clearly than broad paid or viral acquisition does. A list can be big and still be asleep.
Customer discovery also becomes measurable when interviews are documented consistently. Track the interview count, the ICP match rate, how often people describe the same pain, and requests for a demo or pilot. Consistency is the useful signal here. A smaller set of interviews in which a large majority describe the same problem in nearly identical terms can be more persuasive than a much larger set of scattered findings. The evidence becomes sharper because it shows a shared need within a defined population.
How the ICP definition determines which metrics are meaningful and which are noise
That defined population is a precondition for credible analytics. A vague ICP blends customers likely to retain with those likely to churn, making cohort curves hard to interpret and lifetime-value assumptions unreliable. Large totals do not repair that ambiguity. Investors cannot extrapolate growth without knowing who buys and why, while broad traffic from mismatched channels inflates volume and dilutes conversion and retention signals.
CRV frames credible total addressable market sizing as a bottom-up exercise based on specific customer counts and unit economics. That requires a precise customer definition before the analytics stack is built. In practice, every lead, customer, and LOI should be tagged against ICP criteria from the first interaction, including company size, industry, role, and use case. ICP-match rate then becomes reportable with conversion and retention. This is not a positioning detour, but the boundary that makes the dataset interpretable.
Building the growth narrative from the metrics: how to sequence signals into a fundable story
The investor-facing story should begin with the difficulties customers face. Establish who buys, why now, and what they were doing before. Then show how a specific channel repeatedly reached those customers at a documented cost. The trend must outlast a single launch.
Retention then tests the quality of that growth. A cohort curve that flattens shows that customers stick with the product, making the revenue trajectory more trustworthy. It also supports the lifetime-value assumption used in LTV:CAC. Repeatable channel performance supports the acquisition-cost assumption, while consistent growth across six or more months strengthens the trajectory projection. Each piece earns the next claim.
The data room should preserve that logic. It needs an MRR or ARR trend with month-over-month growth across at least six consecutive months, plus a cohort retention chart that shows the curve. CAC by channel belongs with customer-level payback calculations. Pipeline velocity should show how long deals take to close and whether the cycle shortens as the ICP gets tighter. For B2B SaaS, net revenue retention also shows whether revenue from existing customers grows or shrinks without new customer acquisition.
Presentation can still weaken an otherwise useful dataset. Total users without engagement or retention leave investors to assume the active subset is small. A strong recent month without earlier months can look seasonal or event-driven, while CAC without payback leaves capital intensity unresolved.
How a seed-stage marketing partner changes the timeline and the quality of the metrics story
Producing that evidence requires more than knowing which metrics belong in a deck. Someone has to run acquisition, keep up CRM hygiene, track attribution the same way over time, and make sense of the results while the product is being built. Most seed-stage founders lack the bandwidth to do all of it. Each execution gap can become a gap in the trend line, so analytics is also a staffing problem.
A full-time marketing hire can face the same unfinished foundation. Without a validated playbook or an existing analytics engine, the hire starts by building from scratch while runway passes. An embedded marketing partner offers an alternative by working inside the founder’s workflow and understanding the product roadmap. The role spans positioning, content, acquisition, and email, with measurement built in from day one. Its value lies in continuity.
A partner who has worked with seed-stage B2B companies can link the work in each channel to the metrics investors look at. That includes finding ICP-matched pipeline soon enough to build trend data and shaping the story while the work is still going on. Consistent ownership helps produce a coherent dataset over time. The calendar still sets the limit. Within a 12–18-month runway, the practical advantage is getting the right measurement and acquisition work running early enough for the evidence to mature before the raise.