Building a Traction Narrative for Your Pitch Deck
Show investors the growth trajectory and retention proof that reduce deal risk.

The traction slide now carries more weight than any other page in a seed deck, and the numbers back that up. DocSend's Pitch Deck Report found investors spend markedly more time on the traction slide than on any other slide in a seed deck, and most "no" decisions name weak traction as the reason. Seed money used to be validation money: a check that said "this idea is worth testing." It now sits in the gap between pre-seed validation and the scaling work of a Series A, so founders have to clear real revenue and engagement thresholds before institutional investors take the meeting seriously. The slide that used to be a nice-to-have is now the toll booth.
What investors ask when they read a traction slide
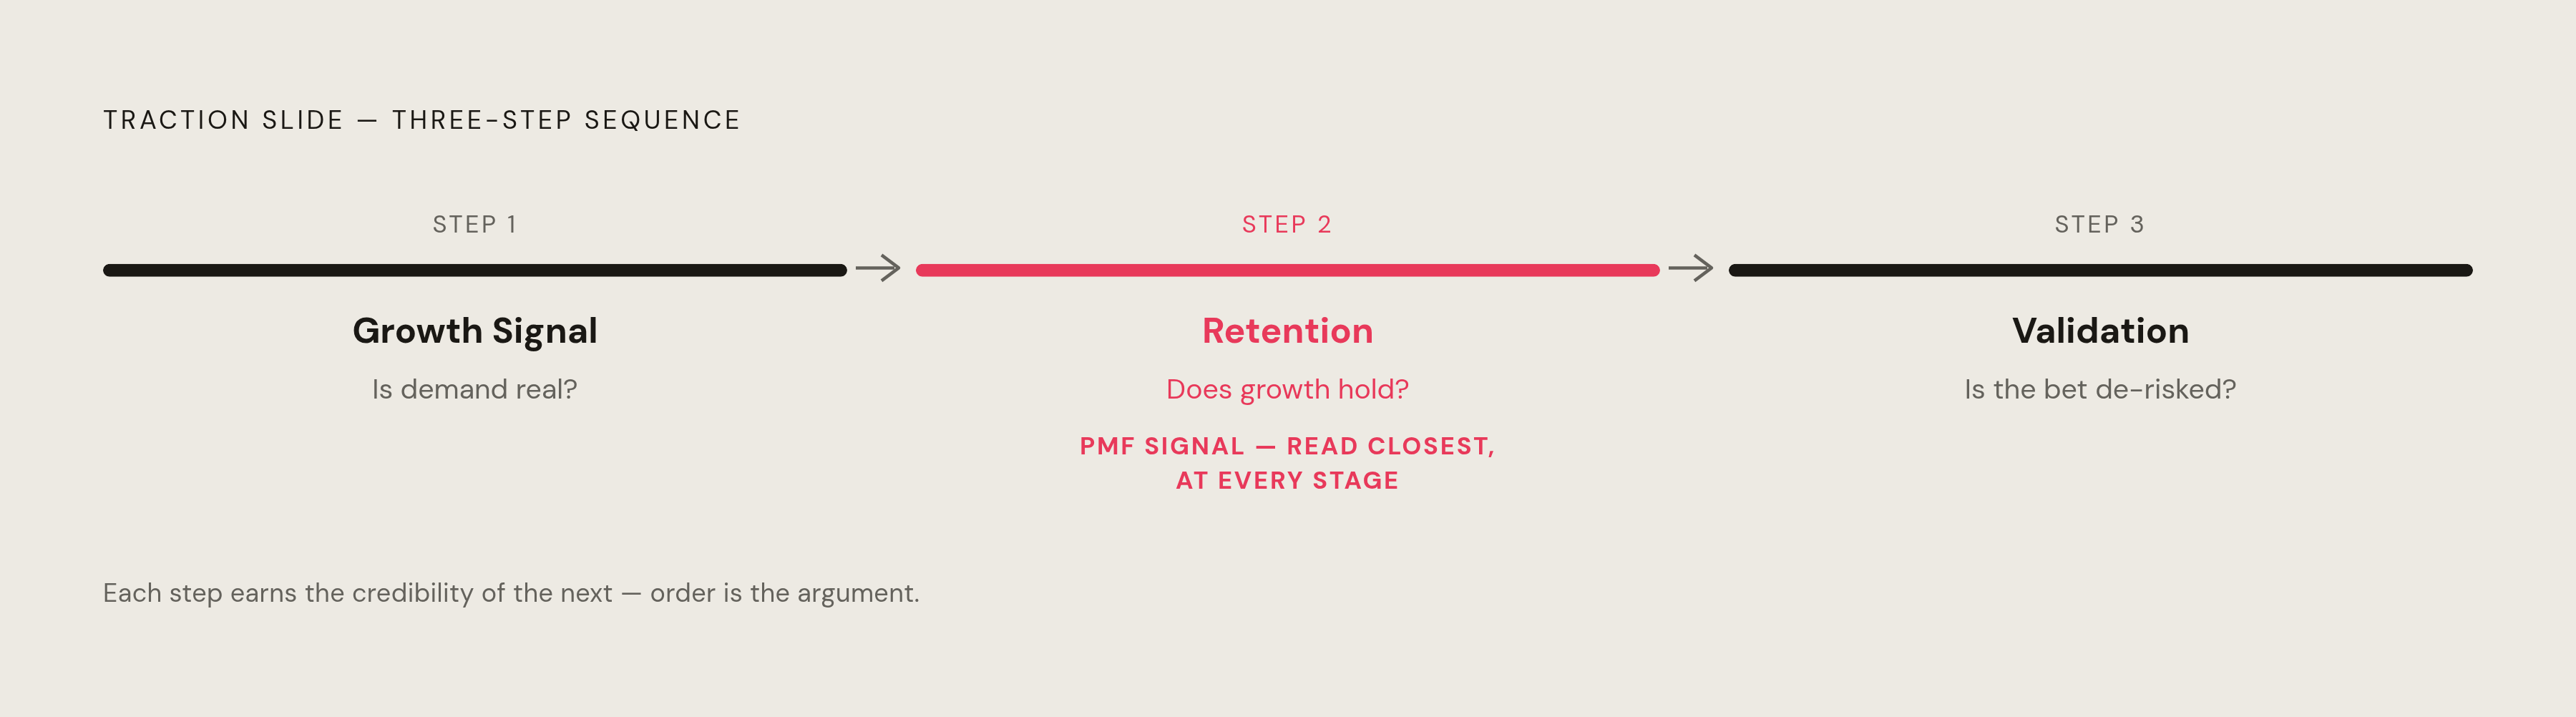
Investors don't read a traction slide to admire what a founder has built. They read it to figure out what could go wrong. Waveup's framework for a strong traction slide comes down to three questions, asked in order: What growth signal proves you've found something real? What retention or efficiency proof shows that growth holds up? What external validation, logos, press, partnerships, lowers the risk of the bet? If a number on the slide doesn't answer one of those three questions, cut it. Retention gets read the closest of all, at every stage, because it's the clearest quantitative sign that the product actually fits a real need. Once you see the slide through that lens, the job changes completely: the founder is curating a case file, not assembling a highlight reel. The most important number goes top-left, with context right underneath it, not buried three lines down where a skimming investor will never find it. That shift, from showcasing to curating, is what decides which metrics make the cut at each stage.
Which metrics belong on the slide, by funding stage
Pick the metrics your stage calls for. Showing up with the wrong ones tells an investor you don't understand how they evaluate deals, and that's a strike against the team before they've read a single number.
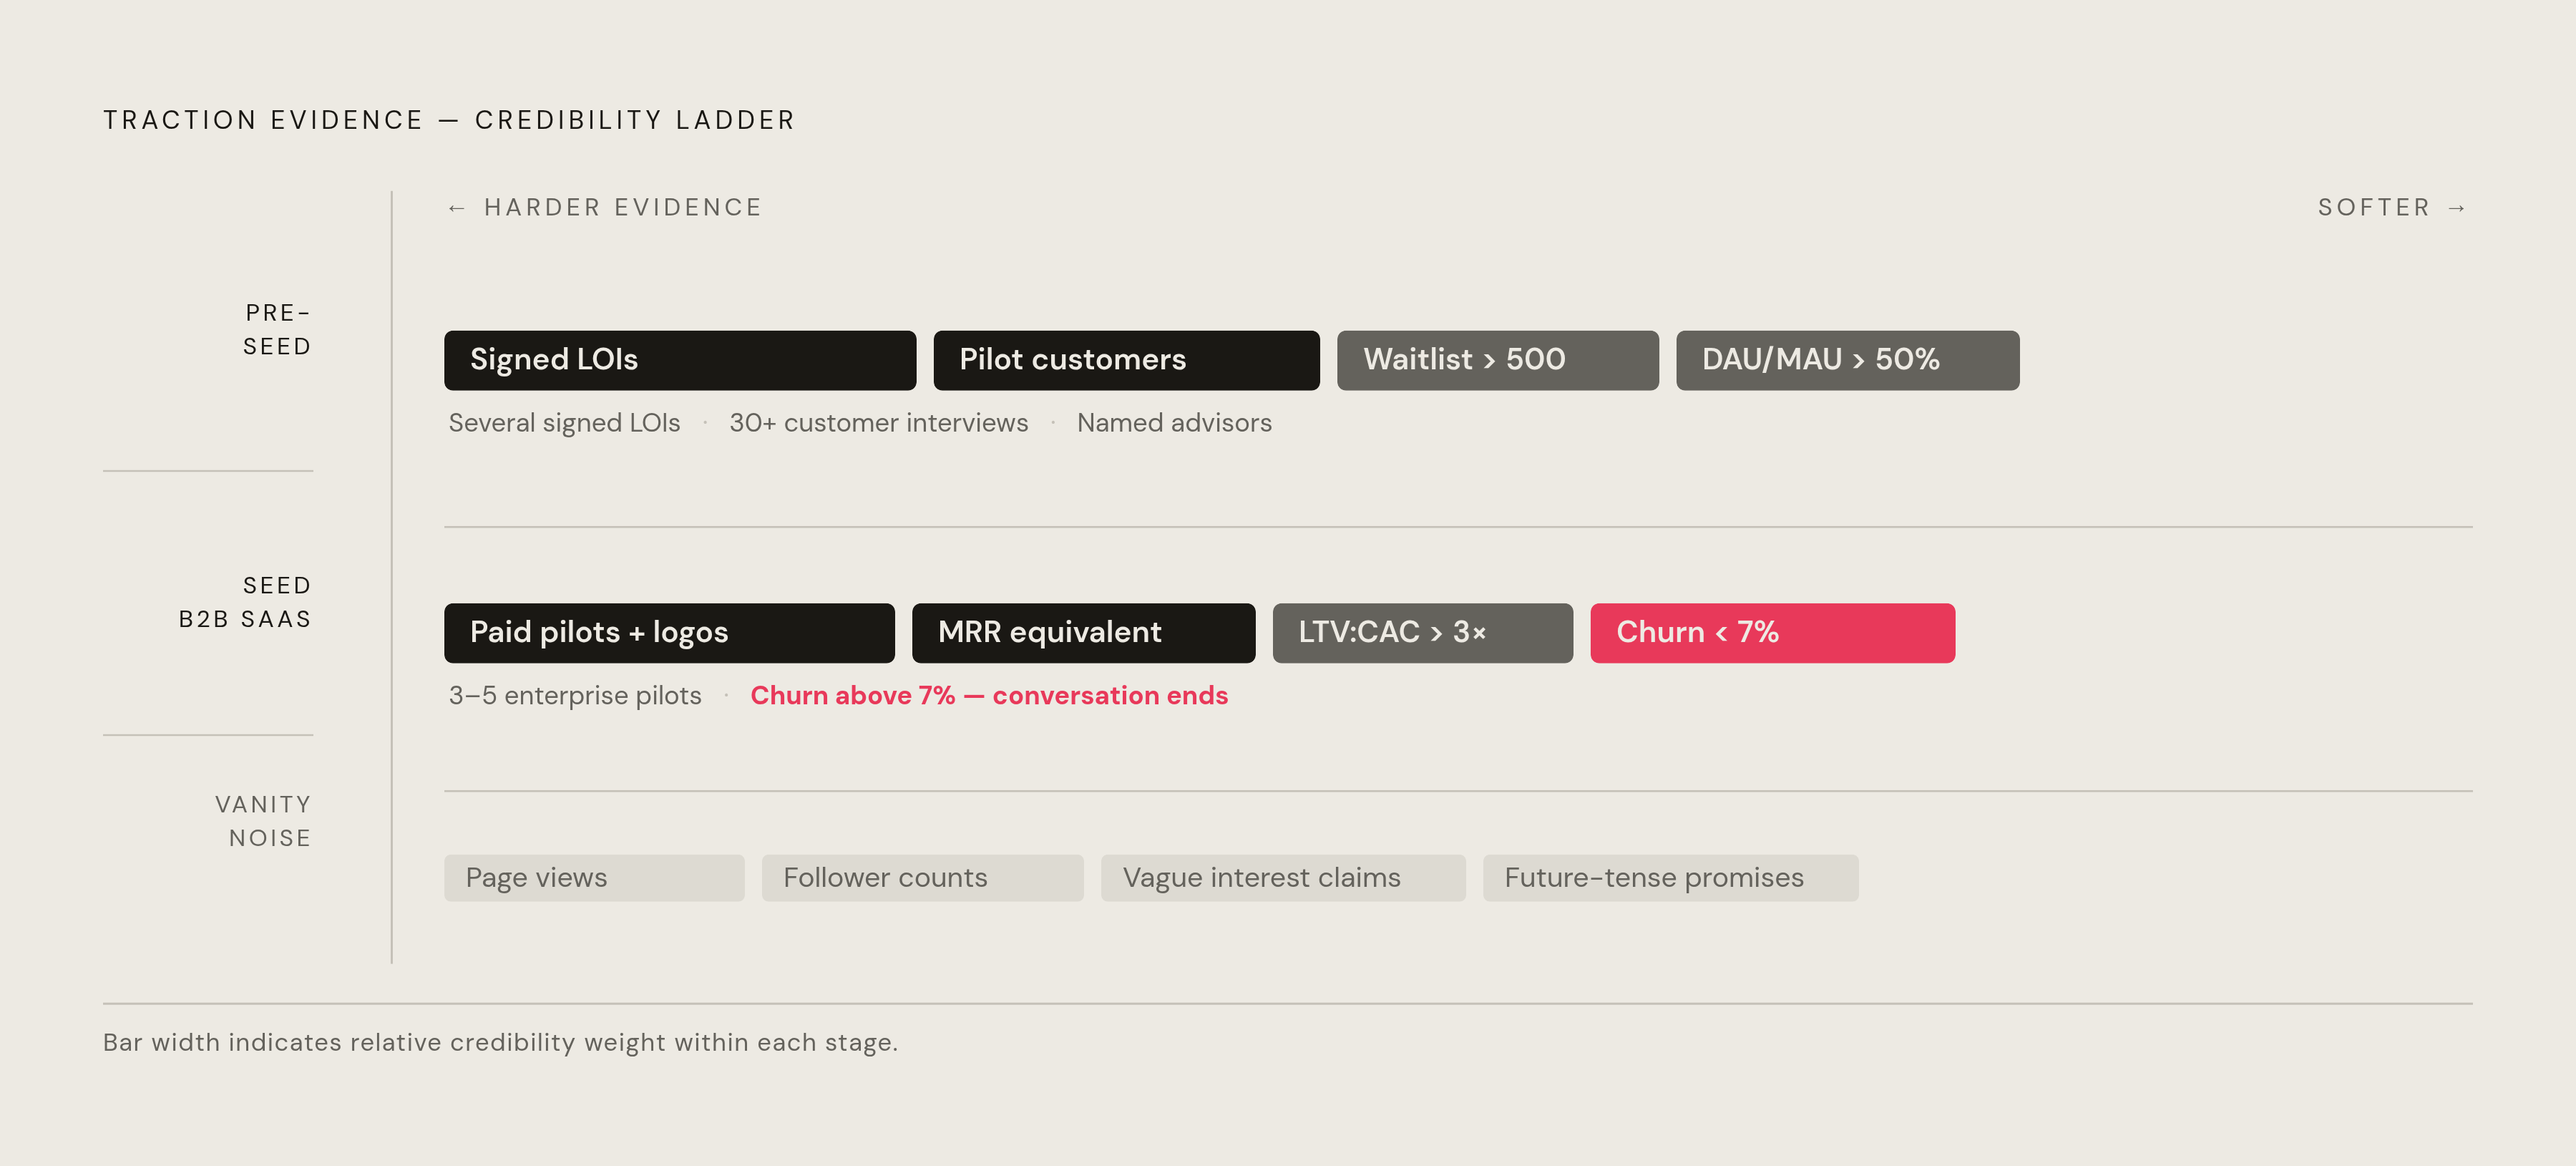
At pre-seed, the signals that matter are waitlist signups, letters of intent, and pilot customers. Deckary's benchmarks point to a sizable waitlist, several signed LOIs, and a DAU/MAU ratio above fifty percent as the thresholds worth hitting.
At seed, for B2B SaaS specifically, the expectations tighten: three to five enterprise pilots (or the MRR equivalent), an LTV:CAC ratio above three times, and gross annual churn under seven percent. Churn above that line at this stage reads as a sign the product doesn't fit the market yet, or that onboarding is broken. Either one is enough to sink the conversation.
When there's no revenue yet, not all "soft" traction counts the same. Real revenue, even a small amount, and paid pilots with named logos sit at the top. Thirty or more deep customer interviews with documented findings, plus named advisor commitments, come in second. Below that line sits everything investors have learned to tune out: vague claims of "lots of interest," vanity metrics like page views and follower counts, and future-tense promises like "we expect to have X by Q3." Leave those off the slide entirely. They don't help; they just signal that the founder doesn't know what's actually being measured.
Deckary's review of traction slides from 75 funded startups found the absolute numbers mattered less than the shape of the growth curve. A company at lower MRR but growing consistently beat out a company with higher MRR and flat or jagged growth, because investors are buying where the company is headed rather than a photo of where it stands today.
How trajectory beats status
That last point is worth sitting inside for a second, because it changes what the slide is supposed to prove. Deckary's guidance leans on a line from Y Combinator: a company growing twenty percent week over week is doing better than a company making a bigger absolute number each week but growing only one percent. The rate of growth is the signal investors are actually pricing over the size of the number on a given Tuesday.
The chart on the slide is doing real argumentative work. Investors spend only seconds looking at a traction slide, so if a chart needs a paragraph of explanation to make sense, it's already failed its one job. A few rules make the chart carry its weight: use line or area charts for revenue or user growth over time, start the axis at zero, keep time intervals consistent, and label the inflection points with what caused them. Use bar charts when comparing one period to the next. Use a waterfall chart when the real story is behind the headline number, with new customer revenue, expansion revenue, and churn broken out so an investor can see which piece is doing the work.
Deckary's structural template keeps it simple: headline metric first (something like ARR, month-over-month growth, and net revenue retention on one line), then two or three supporting metrics below it, then the chart. The chart makes the argument. The numbers are the proof backing it up. And always anchor the timeline: show month one, a midpoint, and today, with the elapsed time labeled. A number with no time attached to it can't show a trend. It can't do the one thing the slide exists to do.
Where traction sits in the deck structure
Where a founder puts the traction slide is itself a message, read before the investor processes a single metric. Waveup's review of more than eight hundred deck rebuilds found that placing traction in the first five slides, right after problem, solution, and market size, meaningfully increases the rate of follow-up meetings. Most founders do the opposite: they bury it near the back, as if it were a appendix rather than the evidence.
CRV's 2026 guide backs this up from the other direction. Founders with genuinely strong numbers who place them late are leaving their best evidence sitting in a part of the deck investors may never reach, given how fast first-pass review happens now.
At Series A, the pattern shifts again. CRV notes that traction tends to show up early in the deck and then return later, in more depth. The early mention earns credibility before the investor has absorbed the full pitch. The later section anchors the scaling plan the deck is building toward.
If traction is strong, lead with it right after the problem slide; if it's limited, place it later and let team and market context carry more of the early weight, but never hide it. The gap between what a deck implies and what diligence later uncovers is what actually kills trust, far more than a modest number ever would. Deck structure is an editorial decision about what story gets told first, and that decision shapes how the numbers inside it get sequenced.
Sequencing numbers into a narrative
A traction slide that lists numbers in the order a founder finds them impressive is a data dump. A traction slide that answers investor questions in the order those questions actually arise is a narrative. The sequence should follow the risk checklist directly: open with the growth signal that shows demand, follow with the retention or efficiency proof showing that growth holds up, close with the outside validation (logos, press, partnerships) that lowers the risk of betting on this team. Each piece sets up the credibility of the next, so order isn't cosmetic, it's the argument.
None of it lands if the customer segment is fuzzy. A precise ICP (specific industry, headcount range, title, problem, purchasing process) makes every metric more believable, because it shows the founder knows exactly who is adopting the product and why, instead of counting anyone who clicked sign-up. Traction also has to match the deck's larger claim. If the pitch is "we win on technology," the traction slide should lead with adoption rates, integration depth, activation speed. If the pitch is "we win on distribution," it should lead with channel efficiency and CAC. Traction that doesn't match the stated differentiator makes the whole value proposition look confused.
Buffer's early seed round is a useful case study here. The team reached out to more than two hundred investors and sat through fifty meetings before closing the round, and they presented that outreach process itself as part of the traction story, openly. Modest early numbers, framed with full honesty about the grind behind them, built more trust than inflated figures ever could have. That's the whole lesson in miniature: a founder who is straight about the size of the slog usually reads as more credible than one holding a shinier, less convincing number.
Seed decks and Series A decks tell different kinds of stories. Seed decks lean on vision, Series A decks lean on traction. A seed founder should sequence metrics to back up the vision, not try to replace it outright with numbers that aren't there yet.
The sequence closes with the ask. CRV's guide is specific here: the use-of-funds slide works best as a set of measurable milestones, not "product development" as a vague catchall, but what gets built, by what date, and how that maps to a business result. That's what turns a traction narrative from a record of the past into a projection an investor can actually evaluate.
What to do when the numbers are thin
Thin traction gets worse in two specific ways: hiding it, or burying it under over-explanation. The better move is to show what exists, with precision, and then state what it proves.
A few things kill credibility no matter the stage: vague talk of "lots of interest" with no numbers attached, vanity metrics like Twitter followers or app downloads with no engagement data behind them, and future-tense claims like "we expect to have paying customers by spring." All three tell an investor the founder isn't tracking the things that actually matter.
When the numbers are thin, the slide's job changes. It's no longer proving scale, it's proving the founder is measuring the right things and moving toward the benchmarks investors expect to see. Showing the metric being tracked, why that metric was chosen, and what the trend looks like over even a short window is more convincing than a flashier number pulled from something irrelevant.
Thin traction usually traces back to one root cause: trying to serve too many customer segments at once. That split attention produces confused messaging and spread-thin resources, and it appears downstream as traction that looks scattered rather than sharp. Narrowing to one segment, one headcount range, one job title, produces a cleaner signal faster than chasing a wider net ever will.
Traction and the Series A thesis
A traction slide that only proves where a company stands today misses the point of the exercise. What it needs to prove is where the company is headed, and how that trajectory lines up with the milestones a Series A investor will eventually need to underwrite. Seed investors are buying the believability of the curve that number sits on, because that curve is what a future Series A investor will hold the company to.
That's why sequencing, placement, and framing matter as much as the raw figures. A founder who shows a precise customer segment, a clear growth rate, honest context around the rough edges, and a milestone-based ask is building the opening chapter of a growth story that has to keep making sense a year from now, when a very different investor sits down to read the same slide with much higher expectations attached to it.